Diagnostics example
Accessing diagnostics information
You can access the diagnostics information for the Kanzi Connect Server running on your local computer by going to one of these addresses using Google Chrome:
http://127.0.0.1:8080/app/index.html#/diagnostics
The older version is deprecated, but still available, and provides different data and view
http://localhost:8080/diagnostics/index.html
Use HTTP instead of HTTPS, because HTTPS does not hold a valid SSL certificate.
Diagnostics dashboard
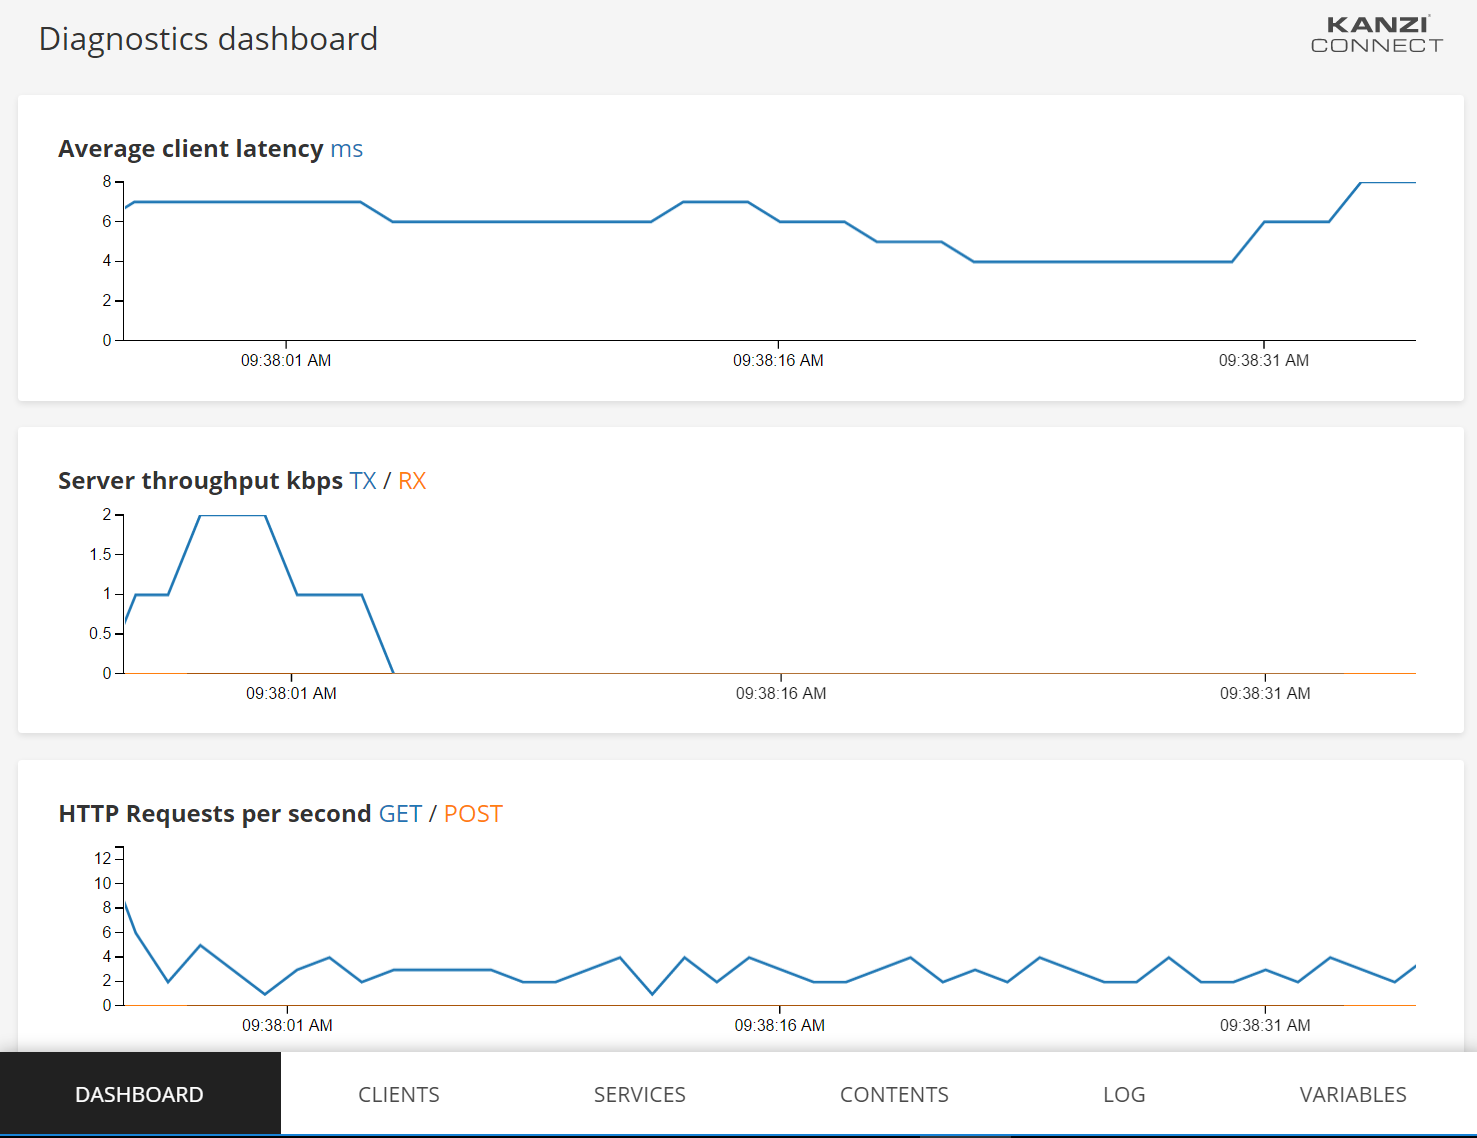
When you use Google Chrome to go to http://localhost:8080/diagnostics/index.html or https://localhost:8843/diagnostics/index.html, you see the Diagnostics dashboard that shows graphs with diagnostic data:
The Average client latency graph shows the average latency for all connected clients. If no clients are connected, the line stays at the bottom (0).
The Server throughput kbps graph shows the amount of application-level data that passes through the Kanzi Connect Server.
The HTTP Requests per second graph shows the amount of HTTP requests made for the Kanzi Connect Server each second.
The diagnostics data is retrieved using HTTP, so when the diagnostics page is active, there is always some HTTP traffic.
Getting different perspectives to the diagnostics information
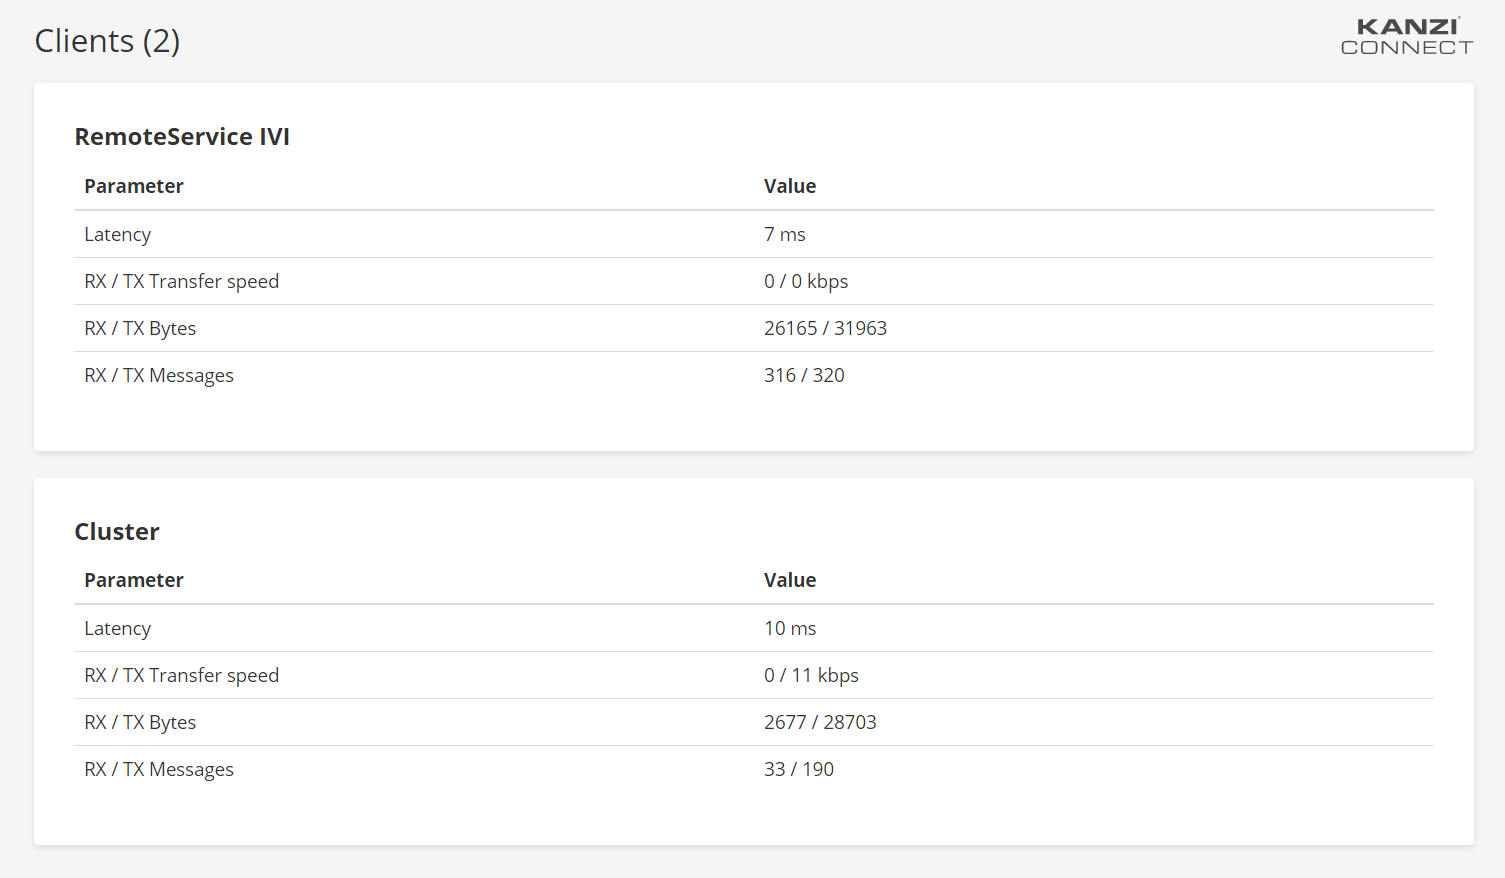
To see a different perspective to the diagnostics information, select one of the options from the bottom of the screen:
Dashboard
Clients
Services
Contents
Log
Variables
For example, the client perspective lists all currently connected clients and information collected from them.
Customizing the diagnostics web page
You can customize the diagnostics page to show different information. You can find the diagnostics web page sources in the <KanziConnectInstallation>/ContentPack/diagnostics directory.