Head-up display example
This example shows how you can create a Kanzi Connect head-up display application using Kanzi Studio.
You can find this example in the <KanziConnectInstallation>/SDK/examples/HUD directory.
Running the example
To run the example:
In Kanzi Studio open the
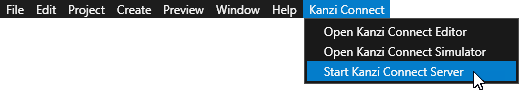
<KanziConnectInstallation>/SDK/examples/HUD/Tool_project/HUD.kzprojproject.In the Kanzi Studio main menu select Kanzi Connect > Start Kanzi Connect Server.
Kanzi Studio starts the Kanzi Connect Server that is installed on your computer.
To run the application on an Android device:
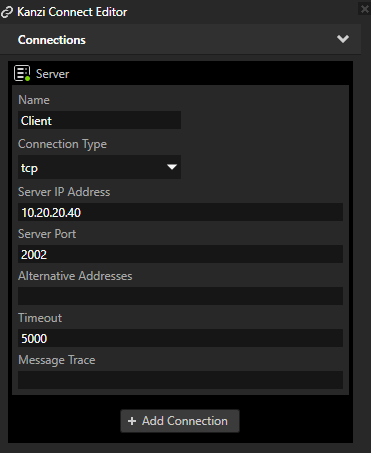
In Kanzi Studio in the Kanzi Connect Editor window set:
Server IP Address to the IP address of the computer where you started the Kanzi Connect Server
Server Port to the port of the computer where you started the Kanzi Connect Server
The Server IP Address and Server Port properties set the address and port of the Kanzi Connect Server that the client application uses during runtime.
Connect your Android device to your computer and set the connection type to Transfer Files.
This way you can access the device file system with Windows Explorer.
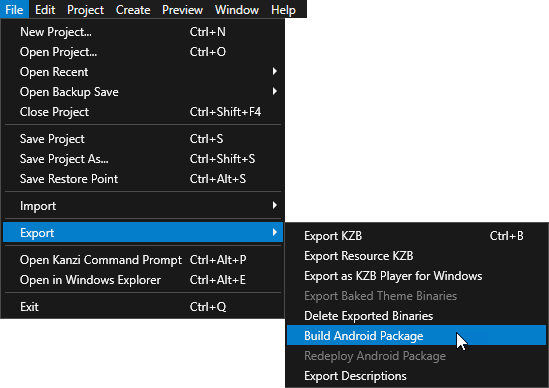
In Kanzi Studio main menu select File > Export > Build Android Package.
Kanzi Studio creates an Android package from your Kanzi Studio project, deploys, and runs it on your Android device.
When the application starts, it connects to the Kanzi Connect Server that runs on the IP address and port you set in the Kanzi Connect window in Kanzi Studio.
Main features
Connectivity through Kanzi Connect
Visualize current engine simulation data (Cluster Service)
Visualize currently playing media track (Media Service)
Visualize current accelerometer data (Sensor Service)
Project structure
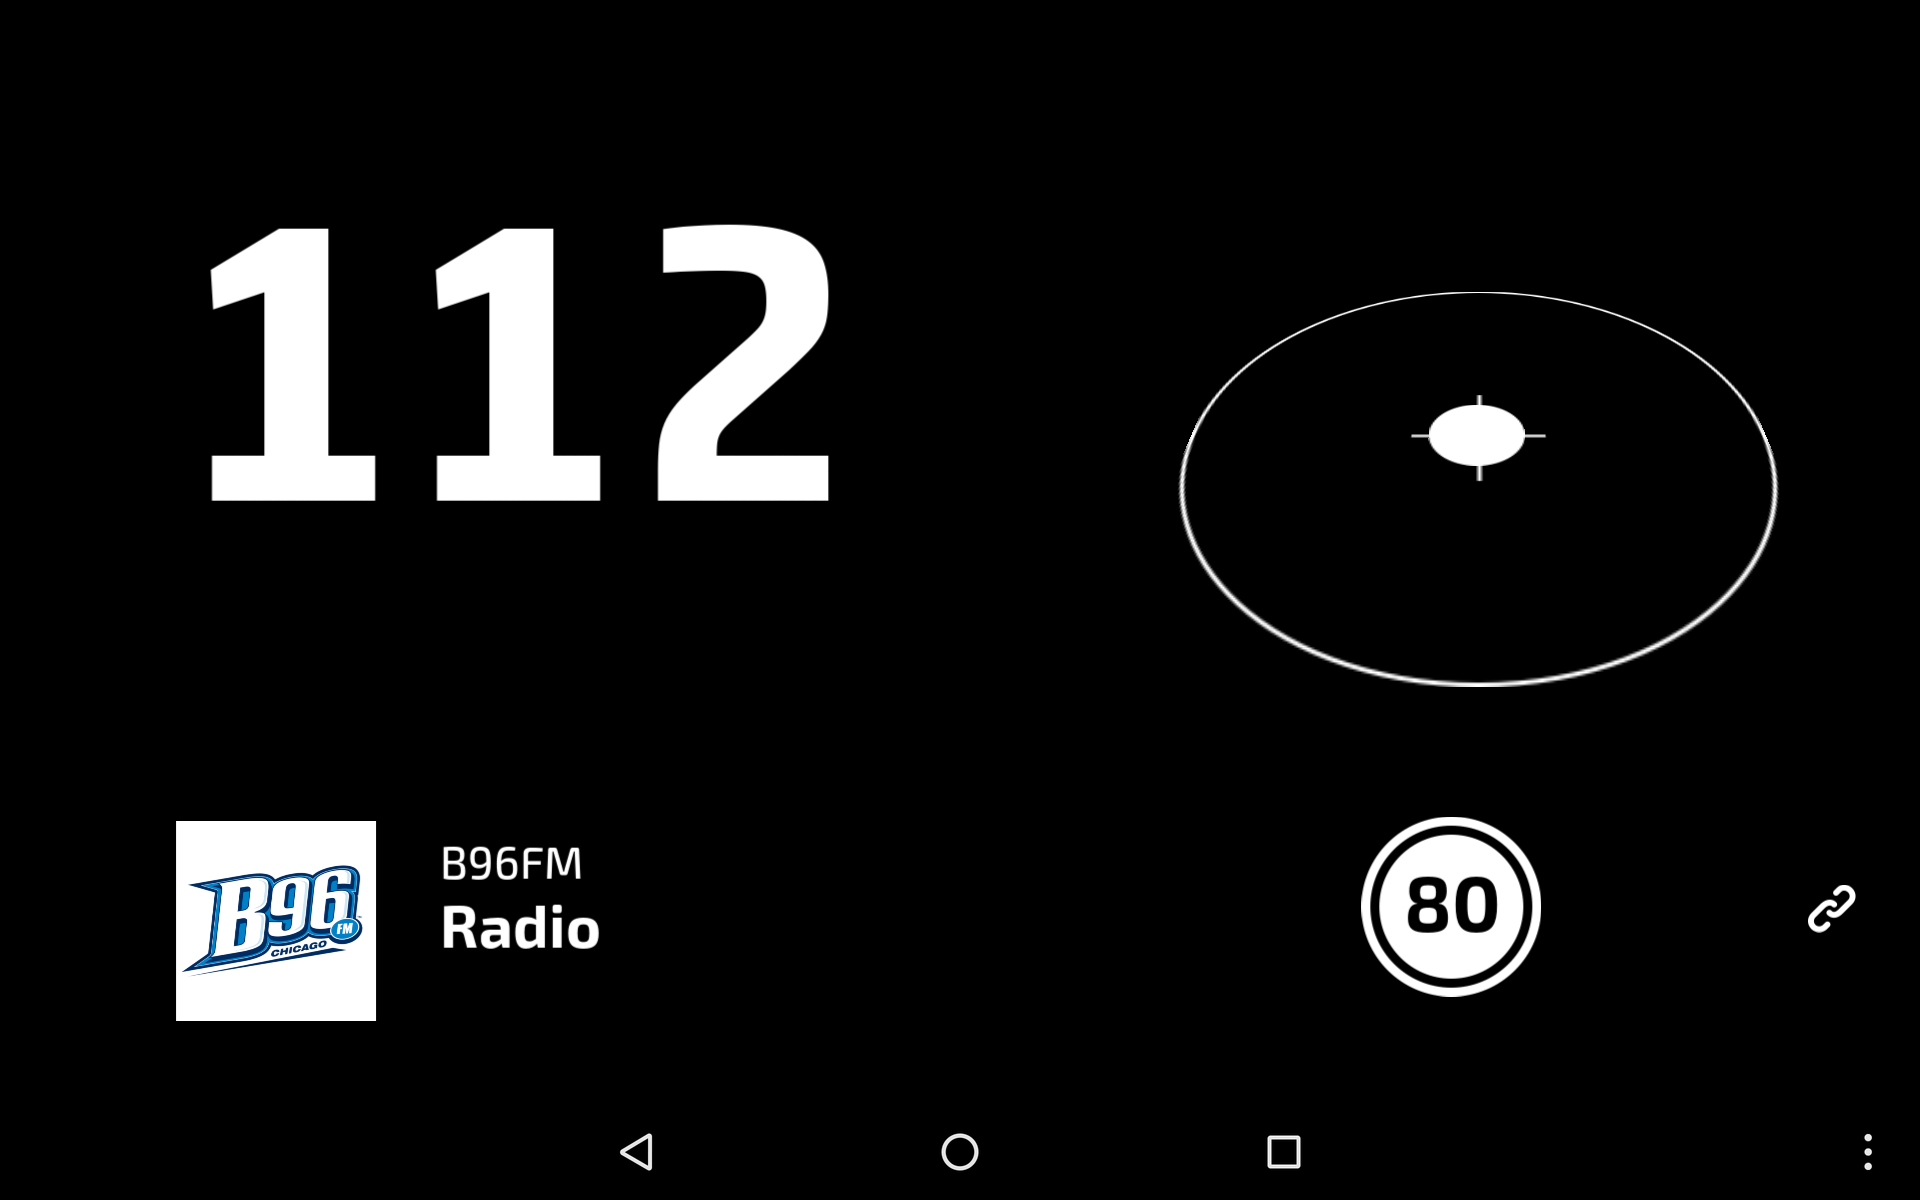
The layout is defined by the RootPage > Grid Layout 2D node that splits the contents into a 2x2 grid layout:
[top, left] cell hosts a location for speed value that is retrieved from the Cluster Service
[top, right] cell hosts a location for accelerometer data that is retrieved from the Sensor Service
[bottom, left] cell hosts a location for current media track info that is retrieved from the Media Service
[bottom, right] cell hosts a location for:
Mock-up speed limit icon
Connectivity icon, which shows whether the application is currently connected to Kanzi Connect Server
Data binding
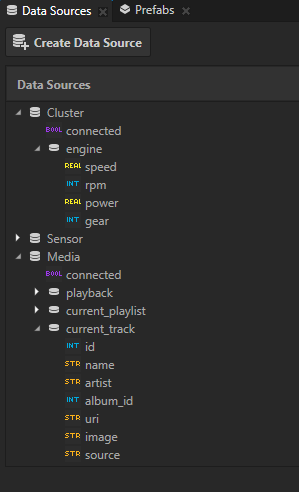
The data sources in this project are imported from the Kanzi Connect. The Data Sources window lists all the data sources in the project:
Cluster
Media
Sensor
The nodes in the example using different data sources to get the data they need. Unless there is an explicit need, all child nodes inherit the data context from their parent nodes. The data sources are set in Screen > RootPage > Grid Layout 2D node:
SpeedValue uses the Cluster data source and has its mapping in the same node.
Media uses the Media data source and its child nodes bind to different data elements:
Album Image has its data binding in Media > AlbumImage
Artist has its data binding in Media > NameStack > Artist
Track Name has its data binding in Media > NameStack > Song
CompassViewport uses the Sensor data source and its child CompassViewport > Scene > BasePlane > Indicator binds the Render Transformation property of the indicator to the accelerometer data and clamps it to a proper range in 3D space.
ConnectionStatus uses the Cluster data source to bind the state of the server connection to the ConnectedState property, which is used to animate the opacity of the icon with a state manager.