Creating a pie chart
You can use the Vector Shapes to render 2D vector graphics. For example, you can use vector shapes to create charts and graphs. In this example, you use the Oval 2D node to create a simple pie chart that consists of two segments whose sizes you control using a custom property type.
To create a pie chart:
Set up your Kanzi Studio project to use the Vector Shapes. See Setting up your Kanzi Studio project.
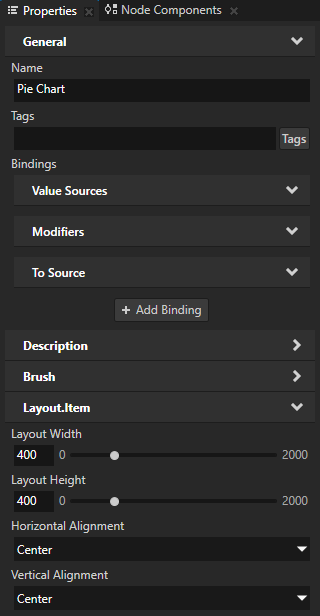
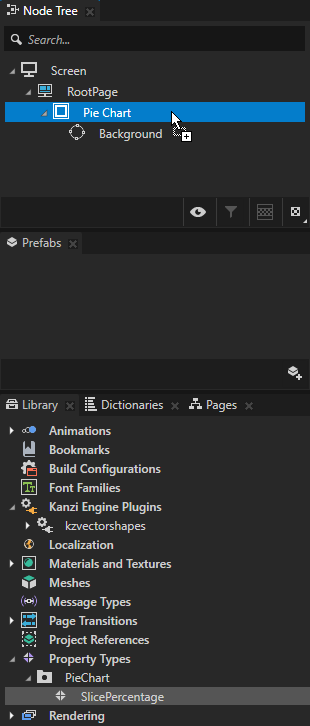
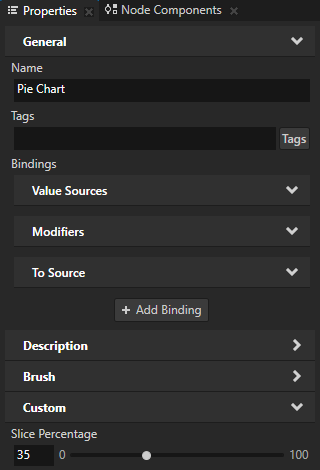
In the Node Tree create an Empty Node 2D node, name it Pie Chart, and in the Properties set the size and position of the node.
For example, in the Properties add and set:
Layout Width and Layout Height to 400.
Horizontal Alignment and Vertical Alignment to Center.
You use this Empty Node 2D node to group the nodes that make up the pie chart.
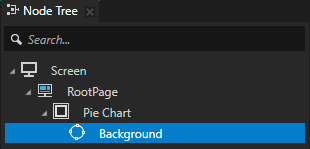
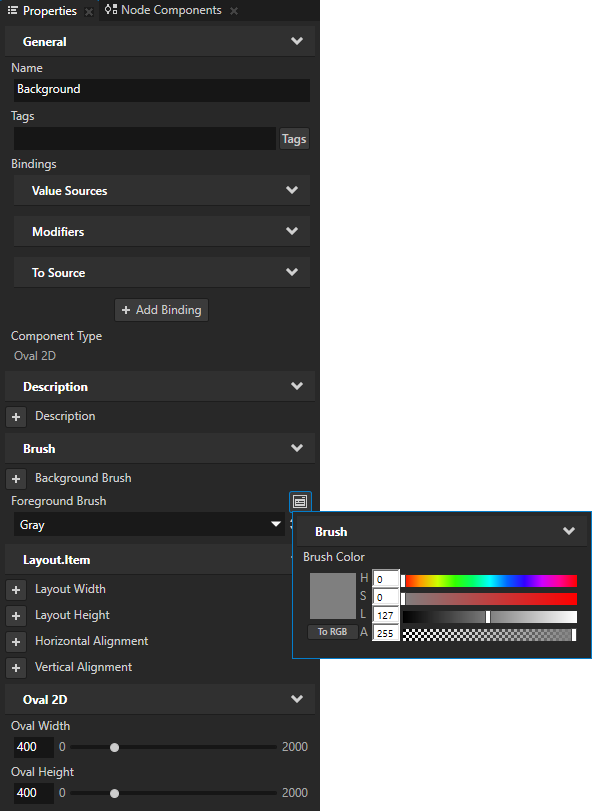
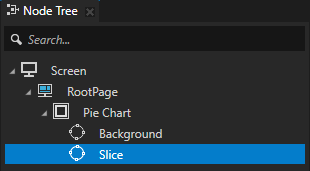
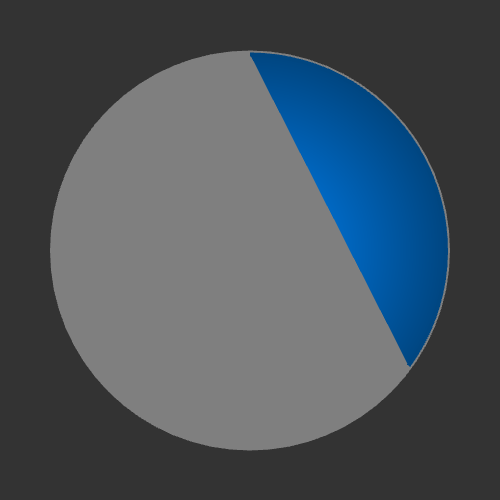
In the Node Tree in the Pie Chart node create an Oval 2D node, name it Background, and in the Properties add and set:
Oval Width and Oval Height to set the size of the node the same as the size of the Pie Chart node.
For example, set them to 400.
Foreground Brush to the brush that you want to use to fill the background of the pie chart. To learn more about brushes, in Kanzi documentation see Working with > Brushes.
For example, select + Color Brush, name the brush, click
 next to the Foreground Brush property, and set Brush Color to the color that you want to use as the background of the pie chart.
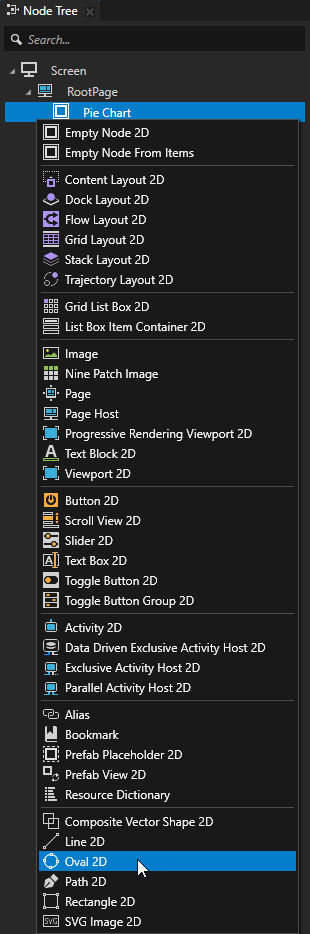

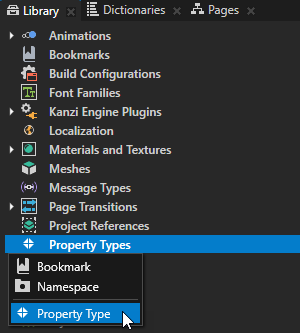
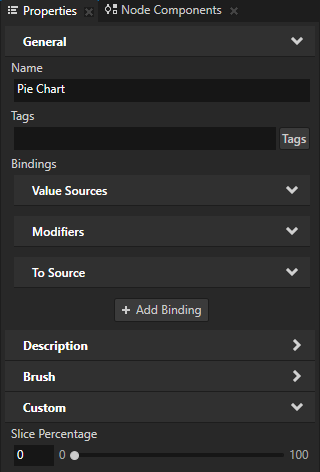
Create a property type that you use to control the size of a slice of the pie:
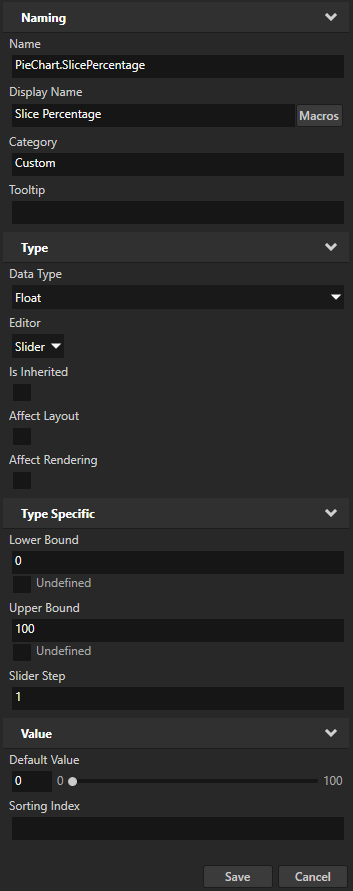
In the Library > Property Types create a Property Type and set:
Name to PieChart.SlicePercentage
Display Name to Slice Percentage
Upper Bound to 100
Slider Step to 1
From the Library > Property Types drag the PieChart.SlicePercentage property type to the Node Tree and drop it on the Pie Chart node.
Draw a slice of the pie:
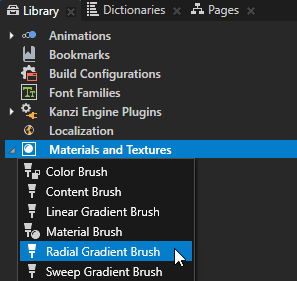
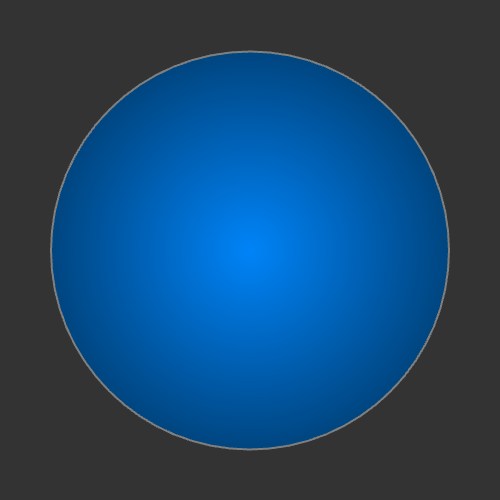
In the Library > Materials and Textures > Brushes create the brush that you want to use to fill the slice.
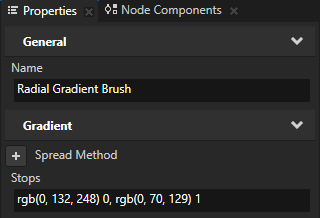
For example, create a Radial Gradient Brush, in the Properties add the Stops property, and set it to:
rgb(0, 132, 248) 0, rgb(0, 70, 129) 1
This way you create a radial gradient from light blue to dark blue. See Filling a vector shape with a radial gradient.
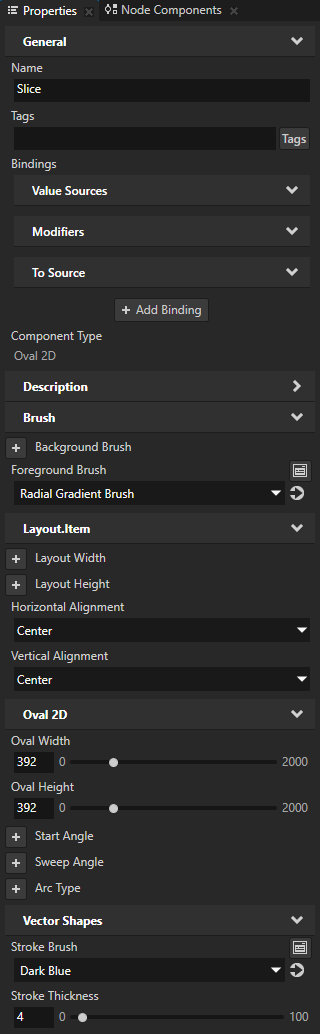
In the Node Tree in the Pie Chart node create an Oval 2D node, name it Slice, and in the Properties add and set:
Foreground Brush to the brush that you created in the previous step.
Horizontal Alignment and Vertical Alignment to Center.
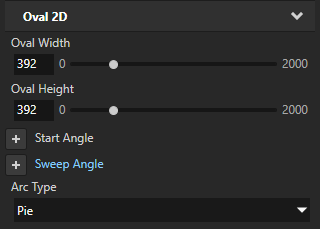
Oval Width and Oval Height to set the size of the oval.
For example, set them to 392.
(Optional) To draw the outline of the slice, add and set:
Stroke Brush to the brush that you want to use to fill the outline.
For example, select + Color Brush, name it, click
next to the Stroke Brush property, and set Brush Color to the color that you want to use as the outline.Stroke Thickness to the width that you want for the outline.
You use this node to draw a slice of the pie chart.
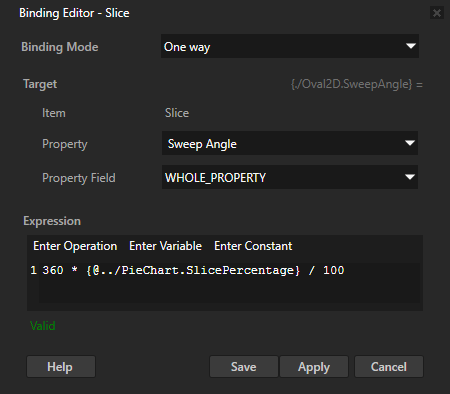
In the Node Tree select the Slice node, in the Properties click + Add Binding, and in the Binding Editor set:
Property to Sweep Angle
This property sets the angle between the start and end point of the arc that draws the slice of the pie.
Expression to
360 * {@../PieChart.SlicePercentage} / 100
Click Save.
You bind the Sweep Angle property to the value of the Slice Percentage property in the Pie Chart node and multiple the percentage by 360 to get the central angle of the slice.
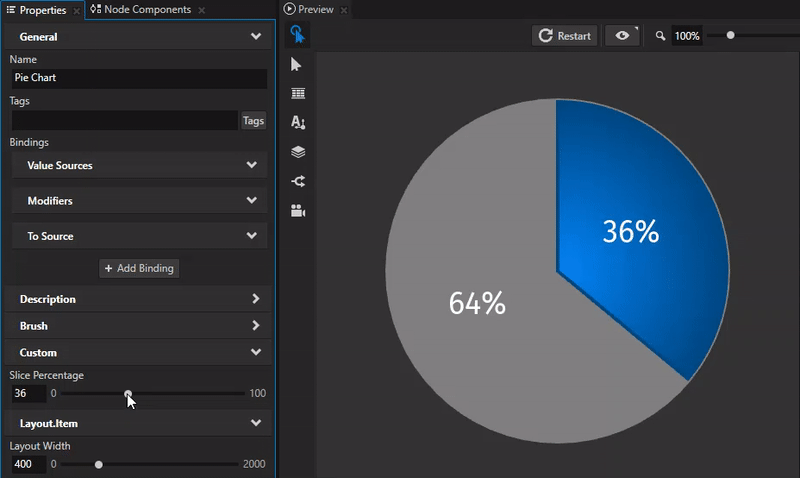
In the Node Tree select the Pie Chart node and in the Properties adjust the value of the Slice Percentage property.
When the value of the Sweep Angle property of an Oval 2D node is less than 360, Kanzi by default draws a circular segment without a chord.
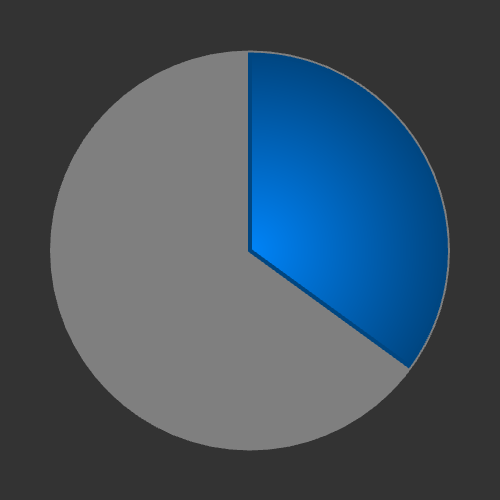
In the Node Tree select the Slice node, in the Properties add the Arc Type property, and set it to Pie.
This way you set Kanzi to draw the Oval 2D node Slice in the shape of a pie.
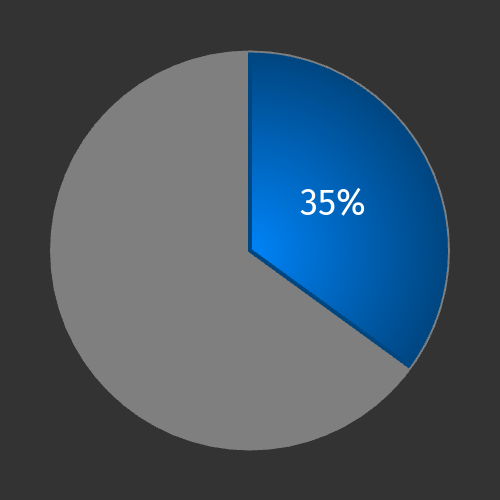
Create labels that show the percentages of the pie chart occupied by the slice and the background:
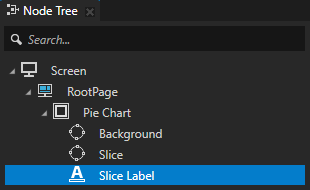
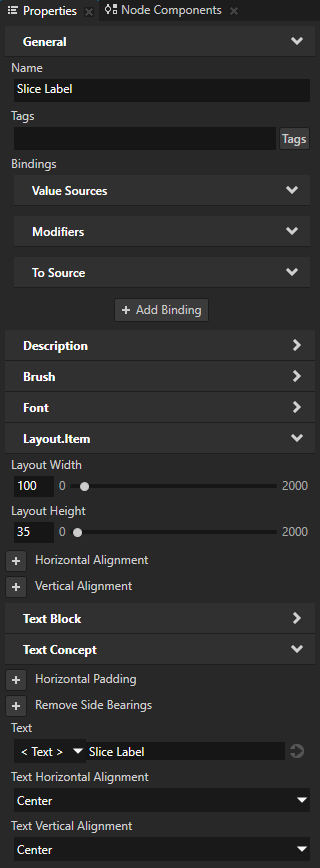
In the Node Tree in the Pie Chart node create a Text Block 2D node, name it Slice Label, and in the Properties add and set:
Layout Width to 100
Layout Height to 35
Text Horizontal Alignment and Text Vertical Alignment to Center
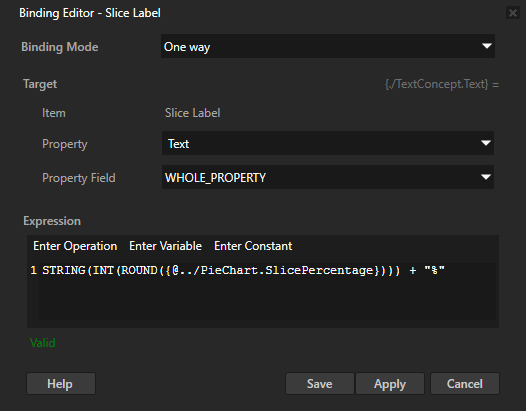
In the Properties click + Add Binding and in the Binding Editor set:
Property to Text
Expression to
STRING(INT(ROUND({@../PieChart.SlicePercentage}))) + "%"
Click Save.
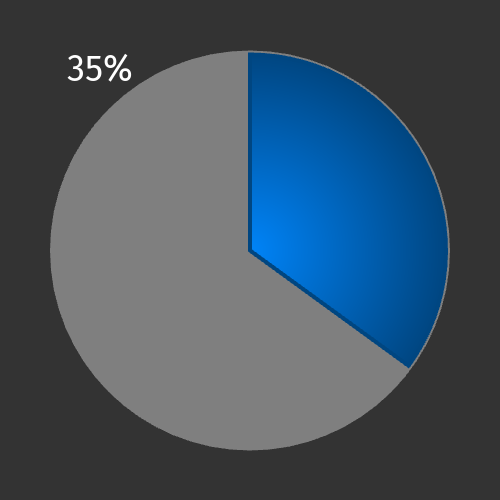
You set the Slice Label node to show how many percent of the pie the slice occupies.
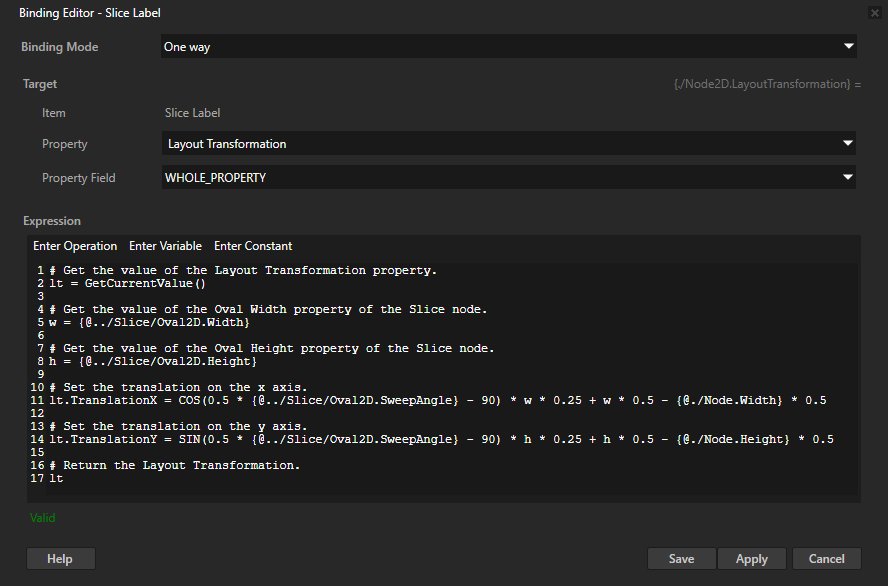
In the Properties add another binding and in the Binding Editor set:
Property to Layout Transformation
Expression to
# Get the value of the Layout Transformation property.
lt = GetCurrentValue()

# Get the value of the Oval Width property of the Slice node.
w = {@../Slice/Oval2D.Width}

# Get the value of the Oval Height property of the Slice node.
h = {@../Slice/Oval2D.Height}

# Set the translation on the x axis.
lt.TranslationX = COS(0.5 * {@../Slice/Oval2D.SweepAngle} - 90) * w * 0.25 + w * 0.5 - {@./Node.Width} * 0.5

# Set the translation on the y axis.
lt.TranslationY = SIN(0.5 * {@../Slice/Oval2D.SweepAngle} - 90) * h * 0.25 + h * 0.5 - {@./Node.Height} * 0.5

# Return the Layout Transformation.
lt
Click Save.
You use this binding to position the Slice Label node so that it is always in the center of the slice.
In the Node Tree duplicate the Slice Label node, rename it to Background Label, and in the Properties:
Click the binding that binds the Text property, and in the Binding Editor set Expression to:
STRING(100 - INT(ROUND({@../PieChart.SlicePercentage}))) + "%"
Click the binding that binds the Layout Transformation property, and in the Binding Editor set Expression to:
# Get the value of the Layout Transformation property.
lt = GetCurrentValue()

# Get the value of the Oval Width property of the Slice node.
w = {@../Slice/Oval2D.Width}

# Get the value of the Oval Height property of the Slice node.
h = {@../Slice/Oval2D.Height}

# Set the translation on the x axis.
lt.TranslationX = COS(0.5 * {@../Slice/Oval2D.SweepAngle} + 90) * w * 0.25 + w * 0.5 - {@./Node.Width} * 0.5

# Set the translation on the y axis.
lt.TranslationY = SIN(0.5 * {@../Slice/Oval2D.SweepAngle} + 90) * h * 0.25 + h * 0.5 - {@./Node.Height} * 0.5

# Return the Layout Transformation.
lt
When you adjust the value of the Slice Percentage property in the Pie Chart node, in the Preview the labels show the percentages and stay in the center of the slice and background.