Using vector shape nodes
The Vector Shapes provides these nodes for drawing vector shapes:
Line 2D node to draw straight lines.
Rectangle 2D node to draw rectangles.

Oval 2D node to draw arcs, ellipses, circles, pie shapes, and segments.
For example, you can use the Oval 2D node to create a pie chart. See Creating a pie chart.

Path 2D to draw arbitrary shapes. See Drawing complex shapes.

Composite Vector Shape 2D to group vector shape nodes and to apply Boolean operations on the geometry of the nodes. See Grouping vector shapes.
SVG Image 2D node to show svg images. See Showing SVG images.
Filling a vector shape
Use a brush to fill the foreground of a vector shape
To set the fill of a vector shape:
In the Library > Materials and Textures > Brushes create the brush that you want to use to fill a vector shape node.
To learn more about brushes, see:
In Kanzi documentation Working with > Brushes
For example, create a Color Brush.
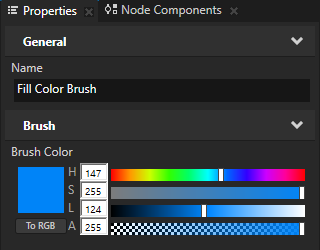
In the Node Tree create a vector shape node, in the Properties add the Foreground Brush property, and set it to the brush that you created.
For example, create a Path 2D node, in the Properties set the Path Commands property to draw a shape, and set the Foreground Brush property to the color brush that you created.
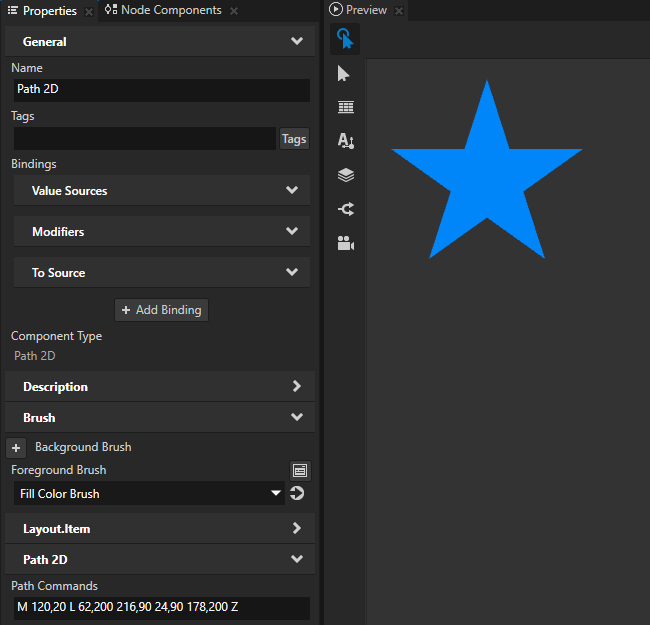
(Optional) To set the appearance of the outline of the vector shape, set the Stroke Brush property.
Kanzi renders the outline on top of the fill and blends the two brushes.
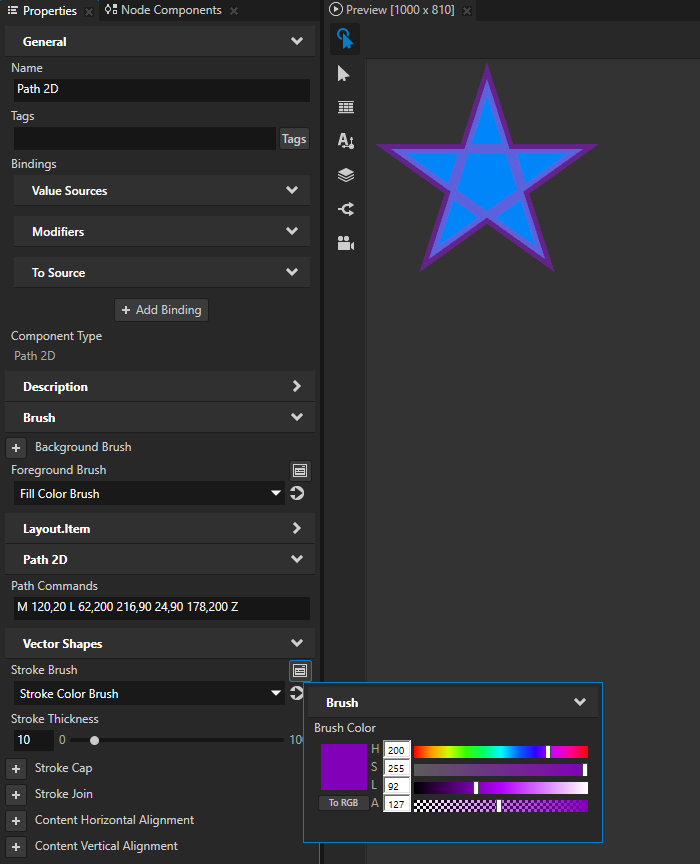
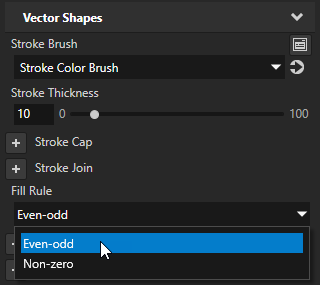
(Optional) To set how Kanzi determines which parts of the shape to fill, in the Properties add the Fill Rule property and set it to:
Even-odd to determine whether a point is inside a shape by drawing a ray from that point to infinity in any direction and counting the number of path segments from the given shape that the ray crosses. If this number is odd, the point is inside the path. Otherwise, the point is outside the path.
Non-zero to determine whether a point is inside a shape by drawing a ray from that point to infinity in any direction and then examining the places where a segment of the shape crosses the ray. Starting with a count of zero, the algorithm adds one each time a path segment crosses the ray from left to right and subtracts one each time a path segment crosses the ray from right to left. If the final result is zero, the point is outside the path. Otherwise, the point is inside the path. This is the default fill rule.
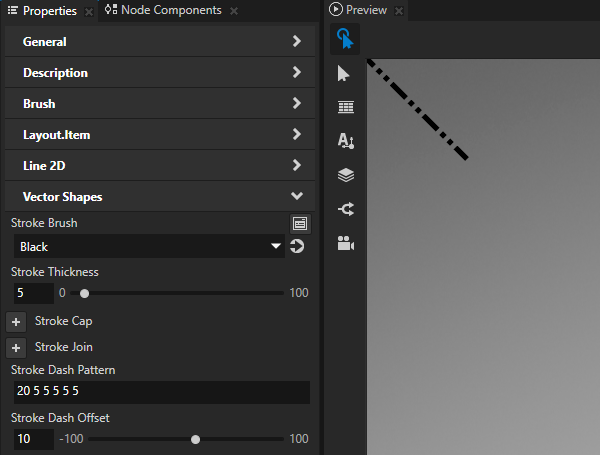
Setting stroke
Use stroke to define the appearance of a line or outline of a vector shape.
To set the style of the stroke:
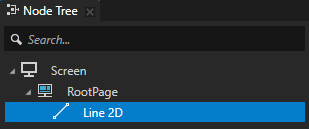
In the Node Tree create or select the vector shape node whose stroke you want to set.
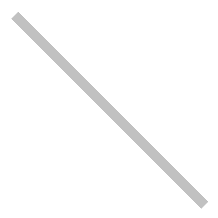
For example, create a Line 2D node.
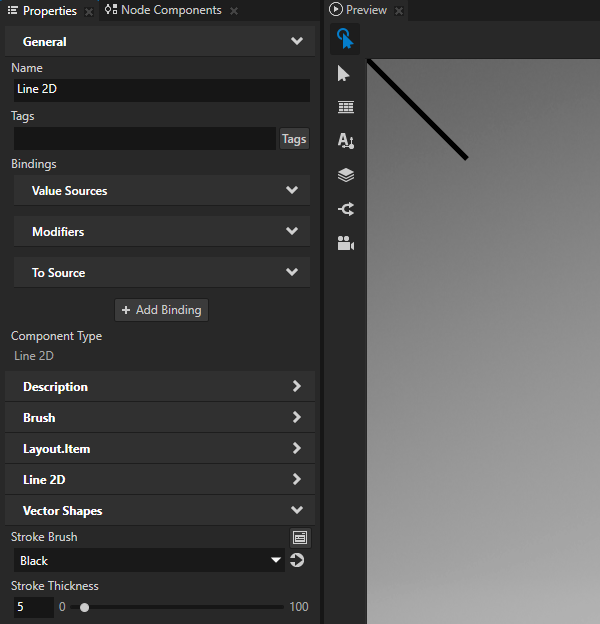
In the Properties add and set:
Stroke Brush to the brush that you want to use to draw the stroke.
To learn more about brushes, see:
In Kanzi documentation Working with > Brushes
Stroke Thickness to the stroke width that you want to use
(Optional) To use a dashed stroke, in the Properties add and set:
Stroke Dash Pattern to set the length of the alternating dashes and gaps.
Enter a list of values separated by spaces or commas, where the first value is the length of a dash and the second value is the length of a gap.
If you enter an odd number of values, Kanzi repeats the list to yield an even number of values.
Stroke Dash Pattern
Result
5
10 5
20 5 10 5
20 5 5 5 5 5
Stroke Dash Offset to define the position along the SVG path where the dash of the stroke begins.
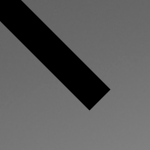
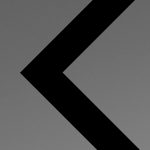
(Optional) To set the shape of the stroke at the ends of a path, add and set the Stroke Cap property to:
Butt to not extend the stroke beyond its endpoints. This is the default value.
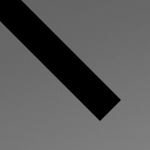
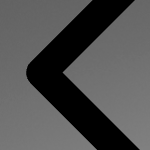
Rectangle to extend the stroke by a rectangle whose width is half of the stroke thickness.
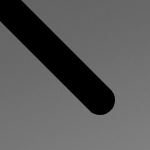
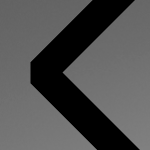
Round to extend the stroke by a half circle whose diameter is equal to the stroke thickness.
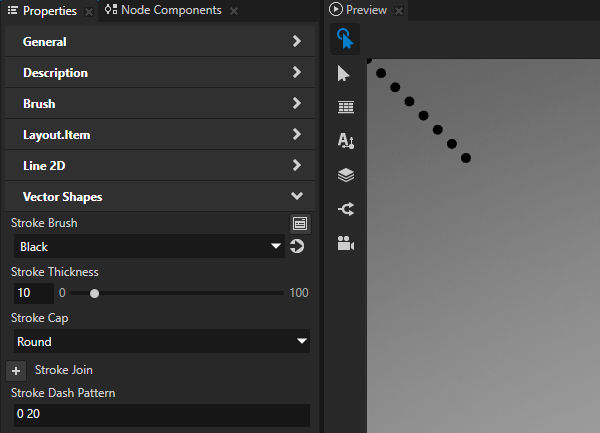
For example, to turn a stroke into a series of circles, set:
Stroke Thickness to the diameter that you want for the circles
Stroke Cap to Round
Stroke Dash Pattern to 0 followed by the distance between the centers of the circles
(Optional) To set the shape of the corner that is formed when the ends of two strokes meet or overlap, add and set the Stroke Join property to:
Miter to use a sharp corner.
This is the default value.
When two line segments meet at a sharp angle, the miter can extend far beyond the thickness of the stroke. You can use the Stroke Miter Limit property to set a limit on the ratio of the miter length to the Stroke Thickness. When the limit is exceeded, Kanzi converts the join to a bevelled join.
Round to use a round corner.
Bevel to use a bevelled corner.
Drawing complex shapes
Use the Path 2D node to draw arbitrary shapes based on SVG 1.1 compliant path data. See https://www.w3.org/TR/SVG11/paths.htmll#PathData.
To draw complex shapes:
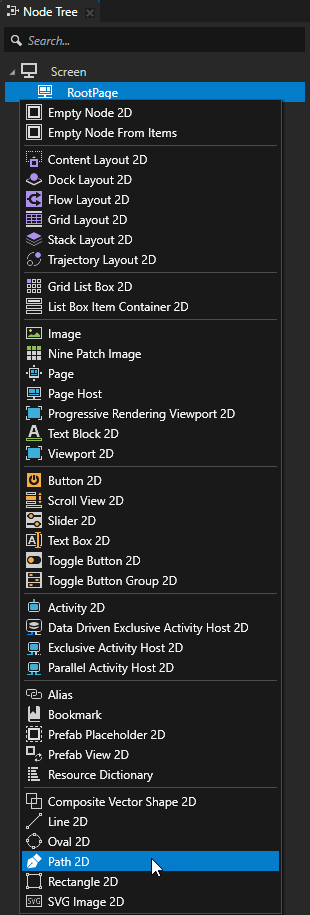
In the Node Tree create a Path 2D node.
In the Properties set the value of the Path Commands property to the SVG path data that defines the shape that you want to draw.
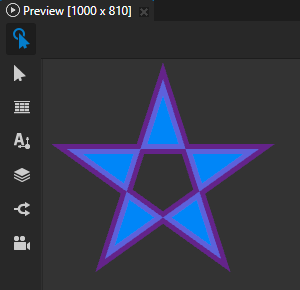
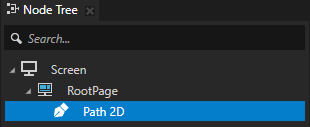
For example, to draw a star, set Path Commands to
M (120, 20) L (62, 200) (216, 90) (24, 90) (178, 200) Z
where:
Mindicates amovetoinstruction which starts a new path at the coordinates x=120, y=20 relative to the top-left corner of the Path 2D node.Lstarts a series oflinetoinstructions that each draw a line from the current point to a given coordinate, which becomes the new current point.Zcloses the path by drawing a straight line from the current point to the initial point of the path.Uppercase letters indicate absolute coordinates within the Path 2D node. Use lowercase commands to indicate coordinates relative to the previous instruction.
Enclosing the coordinates in parentheses is optional and shown here to improve the readability of the commands.
This table shows examples of path commands to draw lines and curves.
Shape |
Command |
Parameters |
Example Path Commands |
Result |
|---|---|---|---|---|
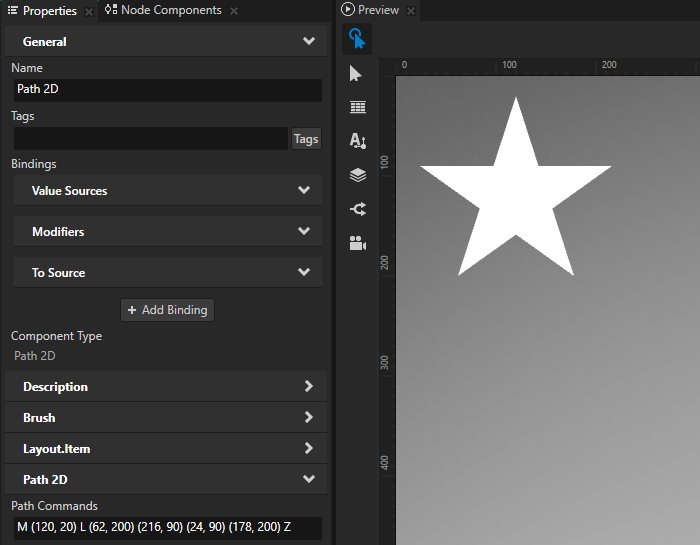
Horizontal line |
|
|
|
|
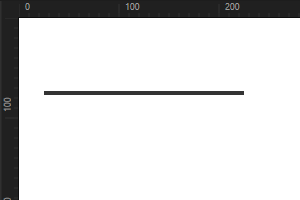
Vertical line |
|
|
|
|
Elliptical arc |
|
|
|
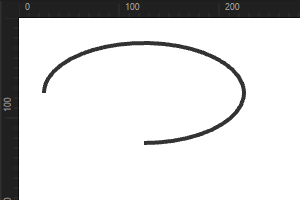
|
Cubic Bézier curve |
|
|
|
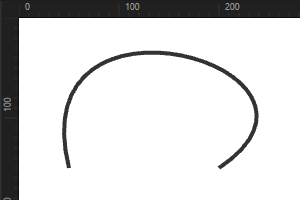
|
Smooth cubic Bézier curve |
|
|
|
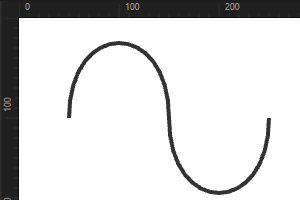
|
Quadratic Bézier curve |
|
|
|
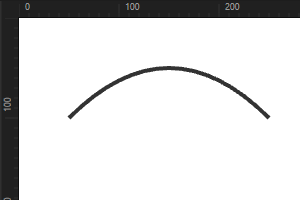
|
Smooth quadratic Bézier curve |
|
|
|
|
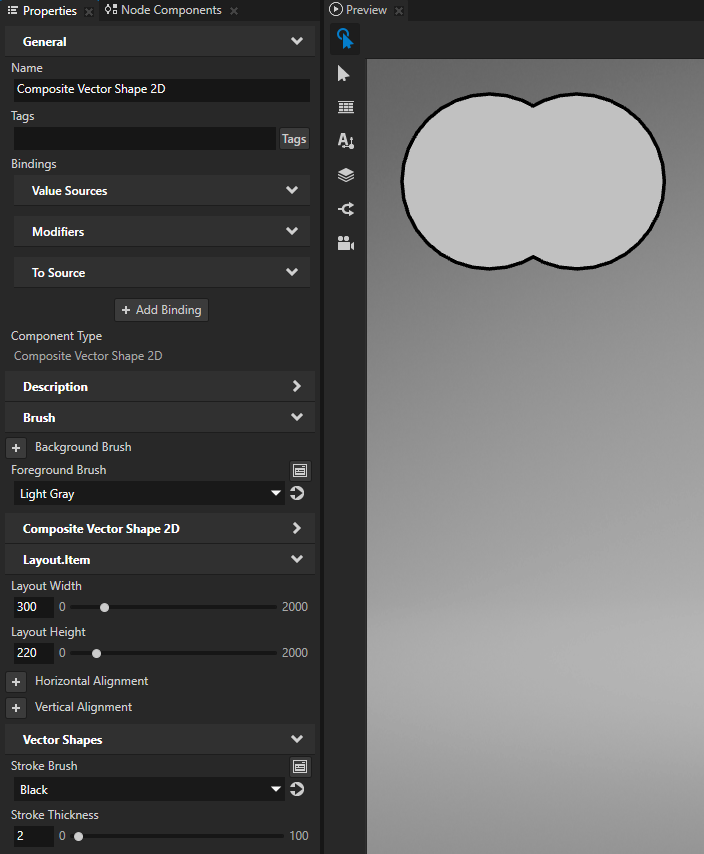
Grouping vector shapes
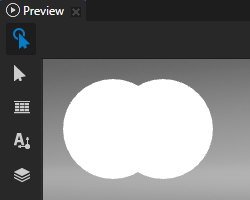
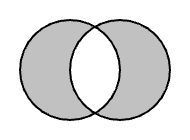
Use the Composite Vector Shape 2D node to combine vector shape nodes using Boolean operations on the geometry of the nodes. The Composite Vector Shape 2D node renders this composite geometry.
To group vector shapes:
In the Node Tree create the vector shape nodes that you want to group.
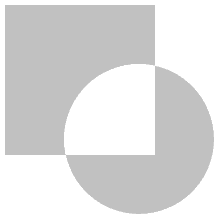
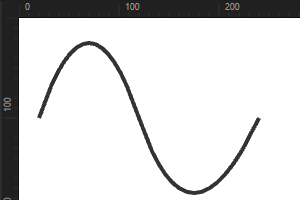
For example, create two Oval 2D nodes and position them so that they overlap partially.
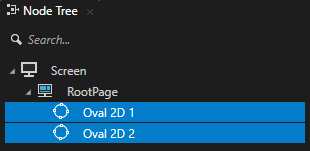
In the Node Tree create a Composite Vector Shape 2D node and drag to it the vector shape nodes that you want to group.
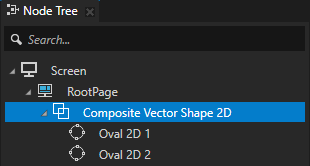
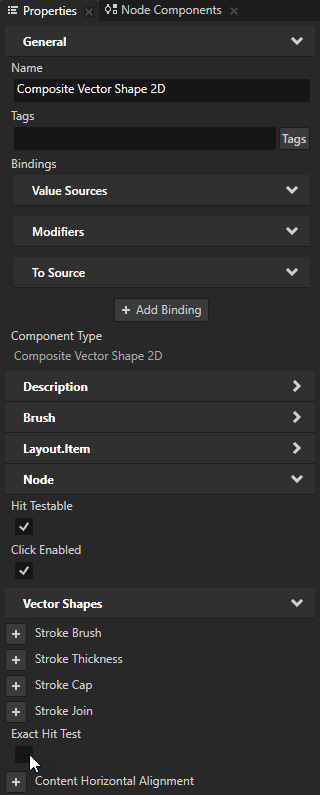
In the Node Tree select the Composite Vector Shape 2D node and in the Properties add and set:
The properties that set the appearance of the shapes that you group. See Filling a vector shape and Setting stroke.
Kanzi applies the values of these properties to the descendants of the Composite Vector Shape 2D node.
For example, set the Foreground Brush, Stroke Brush, and Stroke Thickness properties.
If any of the nodes that you group use non-default alignment, add and set the Layout Width and Layout Height properties.
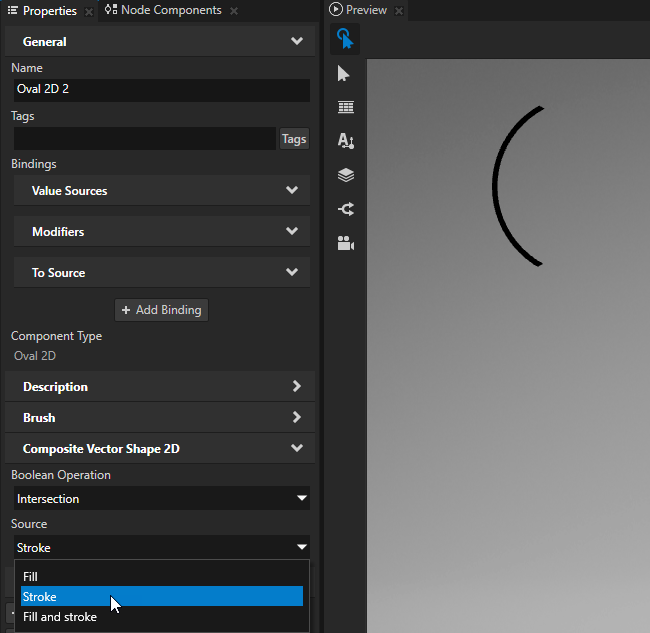
In the Node Tree select one of the descendants of the Composite Vector Shape 2D node, in the Properties add the Boolean Operation property, and set it to the operation that you want to apply to these geometries:
The underlying geometry formed by those descendants of the Composite Vector Shape 2D node that are in the Node Tree above the node in which you set the Boolean Operation property.
The shape of the node in which you set the Boolean Operation property.
These are the available boolean operations:
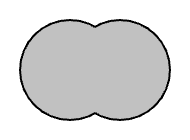
Union renders the combined shape that contains the area of all descendants of the Composite Vector Shape 2D node.
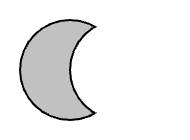
Subtract deducts the shape of the node from the underlying geometry.
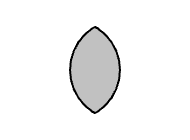
Intersection renders the area where the shape of the node overlaps the underlying geometry.
Difference renders the area where the shape of the node does not overlap the underlying geometry.
(Optional) By default, Kanzi uses fill geometry as the source for the composited shape. To use stroked geometry or both stroke and fill as the source, add and set the Source property.
If you set Source to Fill and stroke, Kanzi first implicitly combines the fill and stroke using the Union operation.
Showing SVG images
Use the SVG Image 2D node to show an SVG image.
The SVG Image 2D node implements a subset of Scalable Vector Graphics (SVG) 1.1. See SVG 1.1 elements and attributes supported by the SVG Image 2D node.
To show an svg image:
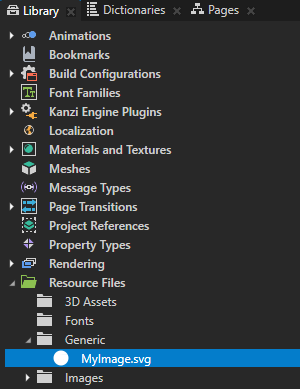
In Windows Explorer store the svg file, which contains the image that you want to show, in the
Tool_project/Genericdirectory of your project.Kanzi Studio shows the svg file in the Library > Resource Files > Generic.
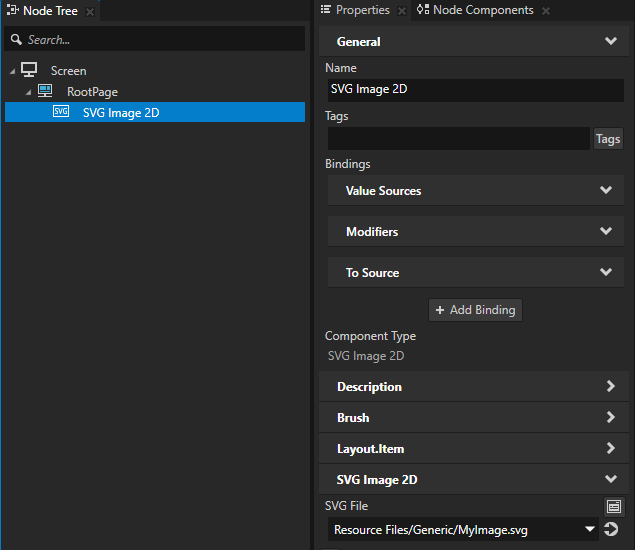
In the Node Tree create an SVG Image 2D node, in the Properties add the SVG File property, and set it to the svg file.
Kanzi creates in the SVG Image 2D node a hidden node tree that renders the content of the svg file.
(Optional) In the Properties add and set:
Layout Width and Layout Height to set the size of the SVG Image 2D node
Content Horizontal Alignment and Content Vertical Alignment to align the image inside the SVG Image 2D node.
Align View Box to disabled to ignore the svg
viewBoxattribute and instead use the content bounds to align the image.In an svg file the
viewBoxattribute of thesvgelement defines the position and size of the svg viewport. By default Kanzi uses the view box to align an svg image.
SVG 1.1 elements and attributes supported by the SVG Image 2D node
The SVG Image 2D node implements a subset of Scalable Vector Graphics (SVG) 1.1.
The SVG Image 2D node supports these elements:
Element |
Attributes |
Notes |
|---|---|---|
|
|
The attributes describe the size of the parent element, needed to convert relative length values from percentage units to pixels. |
|
Parsed for |
|
|
|
|
|
|
|
|
|
|
|
|
|
|
|
|
|
|
|
|
|
The same as polyline but closes the path |
|
|
|
|
|
|
|
|
|
|
|
The SVG Image 2D node supports these attributes:
Attribute |
Description |
|---|---|
|
Converts relative length units other than percentage. The default font size is 12. The ‘em’ unit is implemented with |
|
Defines a list of transform definitions to apply to the current path transformation. |
|
Limited CSS2 style support for these attributes:
|
|
Sets the opacity of the stroke. |
|
Sets the opacity of the fill. |
|
Sets the color of the stroke in these formats: URI, hex, HSL, RGB, CSS extended color keywords. |
|
Sets the color of the fill in these formats: URI, hex, HSL, RGB, CSS extended color keywords. |
|
Sets the width of the stroke. |
|
Sets the shape of the stroke at the ends of a path. Available values: |
|
Sets the style of the area that is formed by two strokes whose ends meet or overlap. Possible values are |
|
Sets a limit on the ratio of the miter length to |
|
Sets a unique ID for an element, usable for links that use the |
|
Sets the coordinate system for the attributes that define a gradient vector. Possible values are |
|
Applies a translate, scale, skew, rotate matrix to the current path transformation. |
|
Sets how to fill a region with a gradient that starts or ends inside the bounds of the region. Available values: |
Setting the input area for vector shape nodes
When you enable hit testing for a vector shape node, the area that receives user input is by default the area formed by the composited geometry of the shapes in that node. To make the entire area of a vector shape node receive user input, in the Node Tree select that node and in the Properties add and disable the Exact Hit Test property.
To learn more about handling user input in Kanzi, in Kanzi documentation see Working with > Input.