Getting started with Profiling Helper Tool
Profiling Helper Tool extracts profiling data from a Kanzi application instance and converts that data to a format that is compatible with visualization tools such as Google Chrome tracing view and Perfetto UI.
Profiling Helper Tool is a Kanzi Engine plugin and is delivered in source code format along with prebuilt binaries for selected platforms.
Configuring Profiling Helper Tool
You can configure the Profiling Helper Tool in the profilinghelper.cfg file.
Configuration option |
Description |
|---|---|
|
Sets how often to collect samples in milliseconds. Enabling this option ensures that samples are not lost but also increases memory usage. Without this flag, only the most recent samples from enabled profiling categories are stored. Default value is 0 (disabled). |
|
Sets the timing of a one-time writing of the output to file in milliseconds. Default value is 5000 ms. |
|
Controls the timing of how often the output is repeatedly written to file in milliseconds. Default value is 0 (disabled). |
|
Sets whether to write the output to file when the application exits. Default value is 0 (disabled). |
|
Sets the name of the file for tracing format output. Default value is |
Using the Profiling Helper Tool application project templates
Use the Profiling Helper Tool templates to create a new application project in Kanzi Studio with Profiling Helper Tool integrated into the project. For instructions on how to add the Profiling Helper Tool templates to Kanzi Studio, see Installing the plugin.
To use the Profiling Helper Tool template:
Install the Kanzi Studio Profiling Helper Tool templates. See Installing the plugin.
In Kanzi Studio, in the Quick Start window, click New Project. In the New Project window, set the Template to the Application with the ProfilingHelper plugin or Android Application with the ProfilingHelper plugin template.

Click Create.
Kanzi Studio creates a project that has Profiling Helper Tool integrated into it. You can collect profiling data from an application built from that project.
Running a project on Windows
To run a project that contains the Profiling Helper Tool plugin on Windows:
In Kanzi Studio, open the project in the
<ProjectDirectory>/Tool_projectdirectory and select File > Export > Export KZB.Select File > Open Kanzi Command Prompt.
In Kanzi Command Prompt, navigate to
<ProjectDirectory>/Applicationdirectory and run the script that generates a Visual Studio solution for the project.For example, if you use Visual Studio 2019, run
generate_cmake_vs2019_solution.bat
This script generates a Visual Studio solution for the application in the directory
<ProjectDirectory>/Application/build_vs2019.In File Explorer go to the
<ProjectDirectory>/Application/build_vs2019directory and open the<ProjectName>.slnVisual Studio solution.In Visual Studio, select the Profiling build configuration.
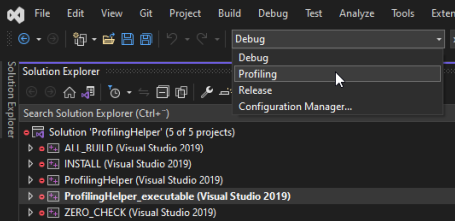
Note
Kanzi Engine provides instrumented data in the Profiling build. Debug and Release configurations only contain profiling data that you introduce.
In the Solution Explorer, right-click the <ProjectName>_executable project and select Set as Startup Project.
Press Ctrl F5 to build and launch the application.
The application creates a
<ProjectDirectory>/Application/bin/tracing_output.jsonfile after the time set in theWritingTimerOnceIntervalconfiguration option elapses. The default time is 5 seconds.This file contains profiling data and it is compatible with the Perfetto UI and Google Chrome tracing view visualization tools.
To learn how to visualize the profiling data, see Using Perfetto UI to visualize Kanzi profiling data and Using Google Chrome to visualize Kanzi profiling data.