Using Perfetto UI to visualize Kanzi profiling data
Perfetto UI is an online tool for visualizing profiling data. After you load Perfetto UI in your browser, you can also use it offline.
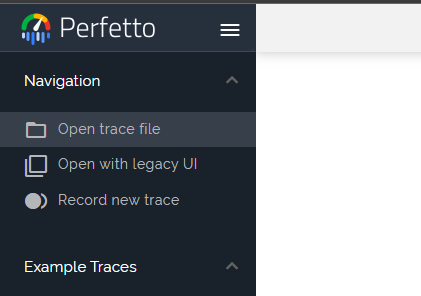
To visualize Kanzi profiling data with Perfetto UI:
Launch a web browser and go to https://ui.perfetto.dev.
Select the STABLE branch.
Click Navigation > Open trace file and select the file that contains your profiling data.
Perfetto UI visualizes the profiling data in the same page.

Tip
In the Perfetto UI page, see Support > Keyboard shortcuts for keyboard shortcuts and mouse controls for actions such as zooming and panning the visualization.