Using the Ellipse nodes
Use the Ellipse nodes to draw arcs, ellipses, circles, circle sectors, and segments.
For example, you can use the Ellipse 2D node to create:
A processing indicator. See Creating a circular processing indicator.
A pie chart. See Creating a pie chart.
Creating an ellipse
To create an ellipse:
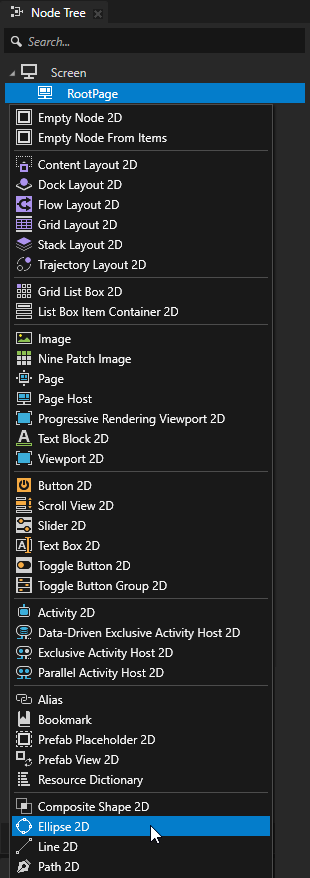
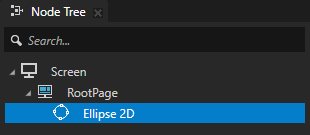
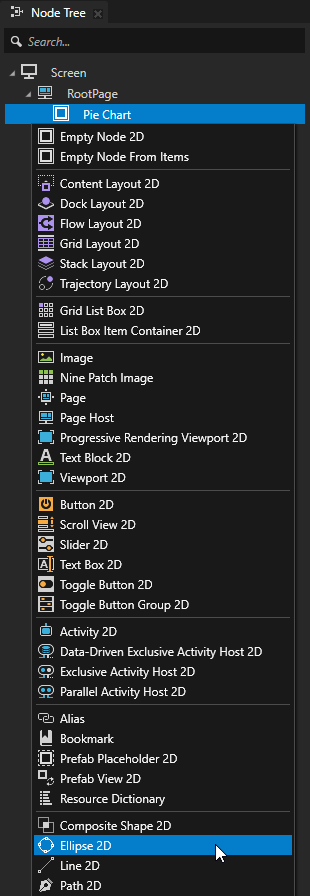
In the Node Tree or Prefabs, press Alt and right-click the node where you want to create an Ellipse node and select either Ellipse 3D, or Ellipse 2D.
You can create a 3D node only in a 3D node, such as the Scene node, and a 2D node only in a 2D node.
Set the fill and stroke of the ellipse. See Filling a shape and Using stroke.
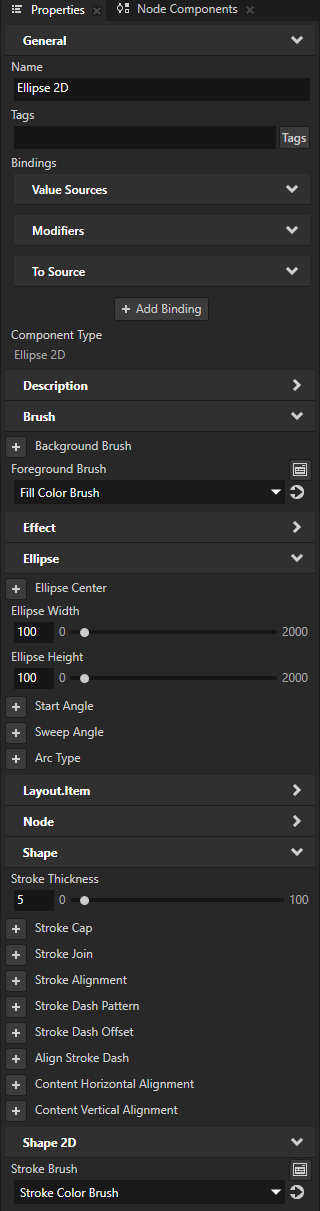
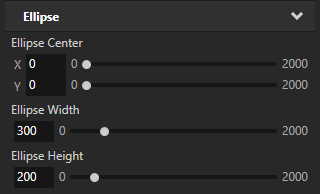
In the Properties, add and set:
Ellipse Width and Ellipse Height to set the size of the ellipse
Ellipse Center to the position along the x and y axis where you want to set the center point of the ellipse
By default, the center point of the ellipse is in the center of the Ellipse node.
For example, to position the center point of the ellipse at the top-left corner of the Ellipse node, set Ellipse Center property X and Y property fields to 0.
Creating arcs, segments, and sectors
To create an arc, segment, or sector of an ellipse:
Create an Ellipse node.
Set the fill and stroke of the ellipse. See Filling a shape and Using stroke.
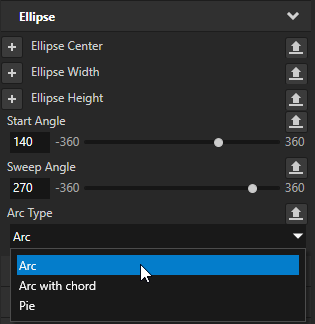
Select the Ellipse node and in the Properties, add and set:
Start Angle to the starting point of the arc in degrees.
The default value 0 sets the arc to start from the top-center point of the Ellipse node.
Sweep Angle to the angle in degrees between the start and end point of the arc.
For example, to draw a half-circle, set Start Angle to 180.
Arc Type to the type of arc you want to draw:
Arc uses the stroke to draw an arc without a chord, and the fill to draw the segment of the ellipse enclosed in the arc.
This is the default value.

Arc with chord draws a segment of an ellipse using the stroke to draw an arc and the straight line that connects the start and end points of the arc.

Pie draws a sector of an ellipse.

Setting the input area for an Ellipse 2D node
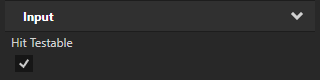
When you enable hit testing for a node with the Input > Hit Testable property, the entire area of that node receives input by default.
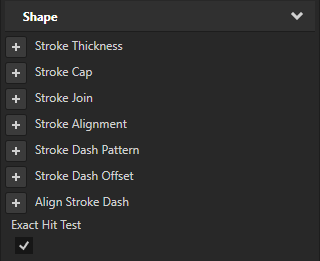
To make only the area formed by the composited geometry of the shapes in a 2D shape node receive input, in the Node Tree or Prefabs, select that node and in the Properties, add and enable the Shape > Exact Hit Test property.
To learn about handling user input in Kanzi, in the Kanzi framework documentation, see Working with > Input.
Creating a circular processing indicator
You can use an Ellipse node to create a circular processing indicator.
To create a circular processing indicator:
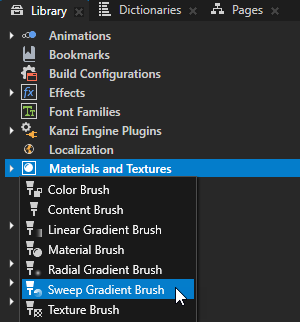
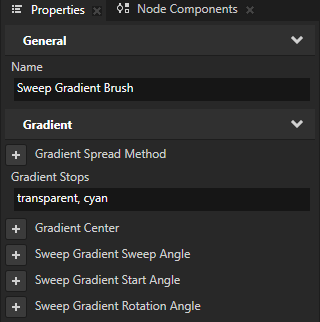
In the Library, press Alt and right-click Materials and Textures and select Sweep Gradient Brush. In the Properties, set the Gradient Stops property to the colors that you want. See Gradient color stops.
For example, set Gradient Stops to
transparent, cyan
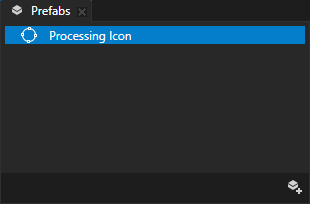
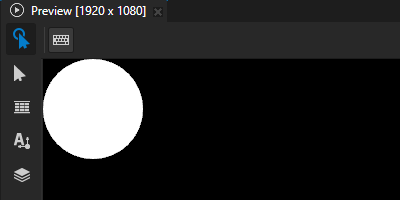
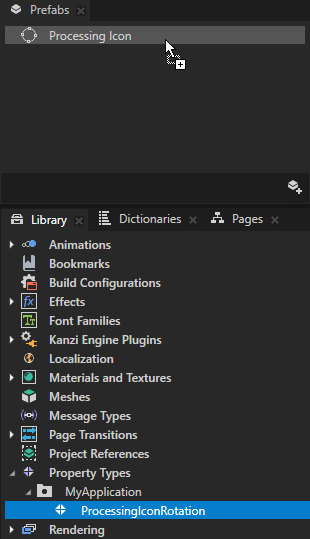
In the Prefabs, create an Ellipse 2D and name it Processing Icon.
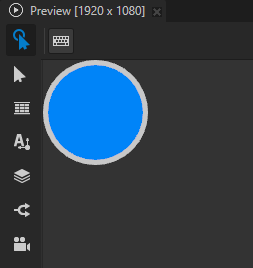
In the Prefabs, double-click the prefab that you created to open only that prefab in a Preview window tab.
This way, you can edit the prefab and see the result of your edits without instantiating the prefab.
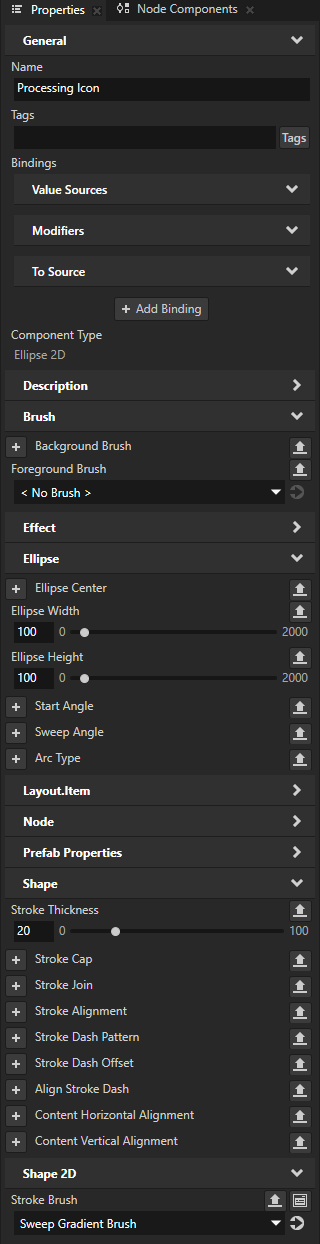
In the Properties, add and set:
Foreground Brush to < No Brush >
Stroke Brush to Sweep Gradient Brush
Stroke Thickness to set the width of the processing indicator ring
For example, set it to 20.

Finalize the look of the processing indicator.
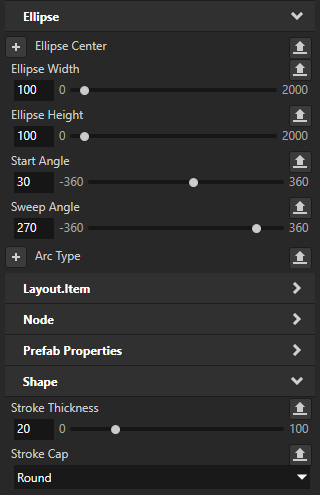
For example, in the Properties, add and set:
Start Angle to 30
This sets the starting point of the arc in degrees to 30 degrees clockwise from the top-center point of the Ellipse node.
Sweep Angle to 270
This sets the processing indicator to span three quarters of a full circle.
Stroke Cap to Round
This extends the stroke at the ends of the arc by a half circle whose diameter is equal to the stroke thickness.

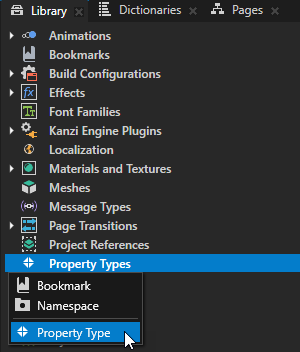
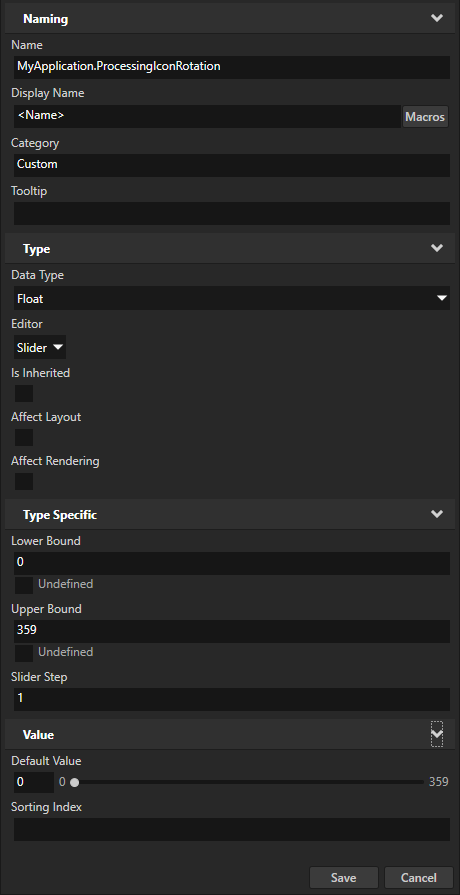
Create a property type that you use to control the rotation of the processing icon:
In the Library > Property Types, create a Property Type and set:
Name to MyApplication.ProcessingIconRotation
Upper Bound to 359
Slider Step to 1
From the Library > Property Types, drag the MyApplication.ProcessingIconRotation property type to the Prefabs and drop it on the Processing Icon prefab.
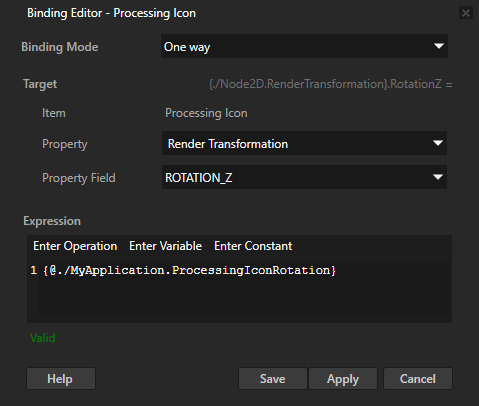
In the Prefabs, select the Processing Icon prefab. In the Properties, click Add Binding and in the Binding Editor:
Set:
Property to Transform 2D > Render Transformation
Property Field to ROTATION_Z
Drag the MyApplication.ProcessingIconRotation property from the Properties to the Expression.
Click Save.
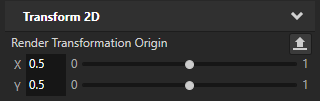
In the Properties, add the Transform 2D > Render Transformation Origin property and set:
X to 0.5
Y to 0.5
This way, you set the origin of the Processing Icon node to its center point so that the node rotates around its center. By default, Kanzi rotates a node around the upper left corner.
Animate the rotation of the processing icon:
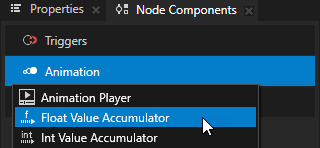
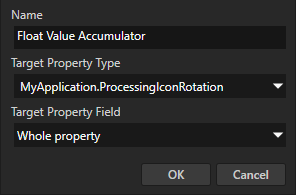
In the Node Components, press Alt and right-click Animation, select Float Value Accumulator, and set the Target Property Type to MyApplication.ProcessingIconRotation.
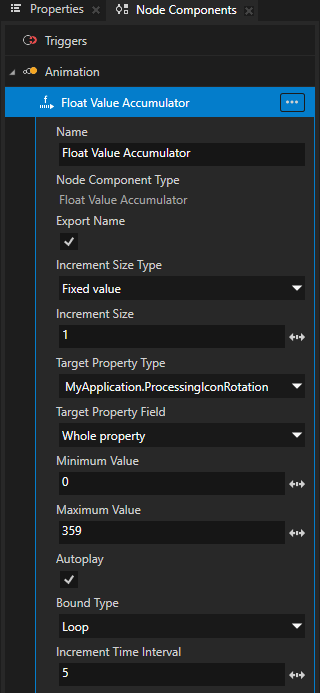
In the Float Value Accumulator, set:
Maximum Value to 359
Increment Time Interval to how often in milliseconds you want to change the value of the target property by the amount set in the Increment Size property.
For example, to rotate the processing icon by one degree every 5 milliseconds, set it to 5.

Creating a pie chart
You can use Kanzi Shapes to create charts and graphs. In this procedure, you use the Ellipse 2D node to create a simple pie chart that consists of two segments whose sizes you control using a custom property type.
To create a pie chart:
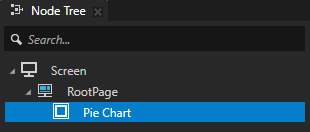
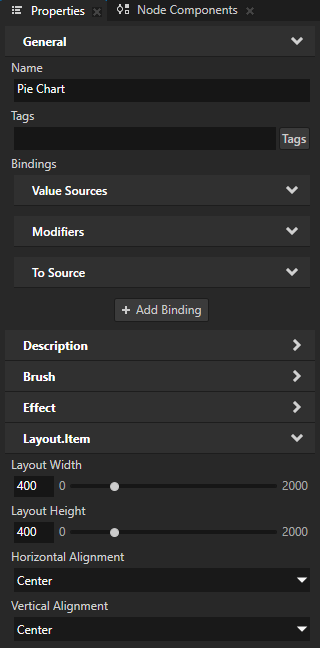
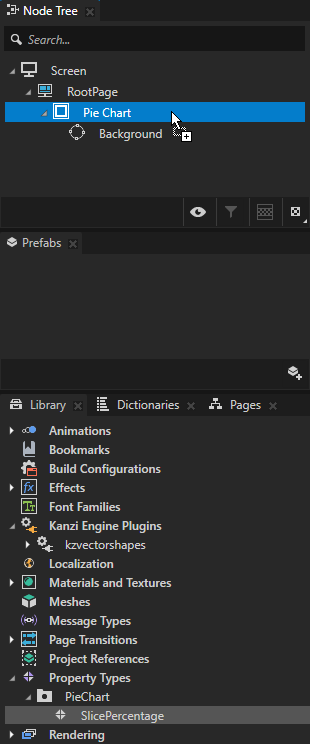
In the Node Tree, create an Empty Node 2D node and name it Pie Chart. In the Properties, set the size and position of the node.
For example, in the Properties, add and set:
Layout Width and Layout Height to 400.
Horizontal Alignment and Vertical Alignment to Center.
You use this Empty Node 2D node to group the nodes that make up the pie chart.
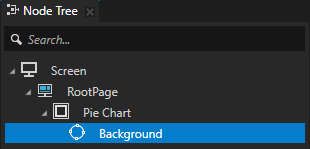
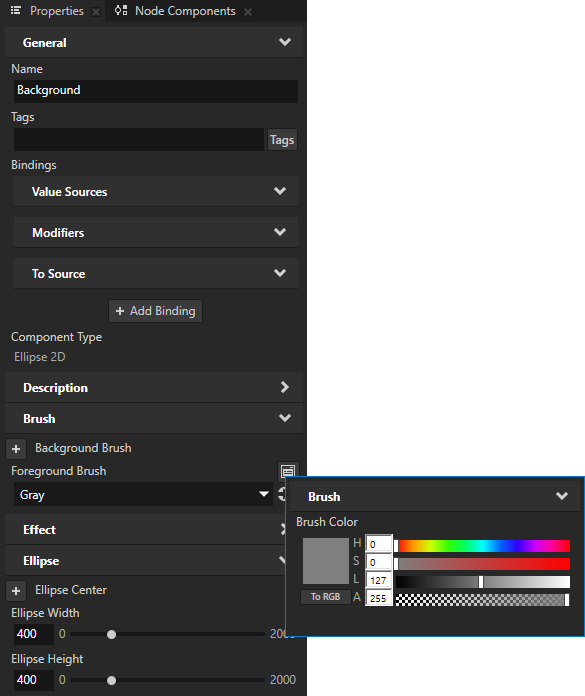
In the Node Tree in the Pie Chart node, create an Ellipse 2D node and name it Background. In the Properties, add and set:
Ellipse Width and Ellipse Height to set the size of the node the same as the size of the Pie Chart node.
For example, set them to 400.
Foreground Brush to the brush that you want to use to fill the background of the pie chart. To learn more about brushes, in the Kanzi framework documentation, see Working with > Brushes.
For example, select + Color Brush and name the brush. Click
 next to the Foreground Brush property and set the Brush Color to the color that you want to use as the background of the pie chart.

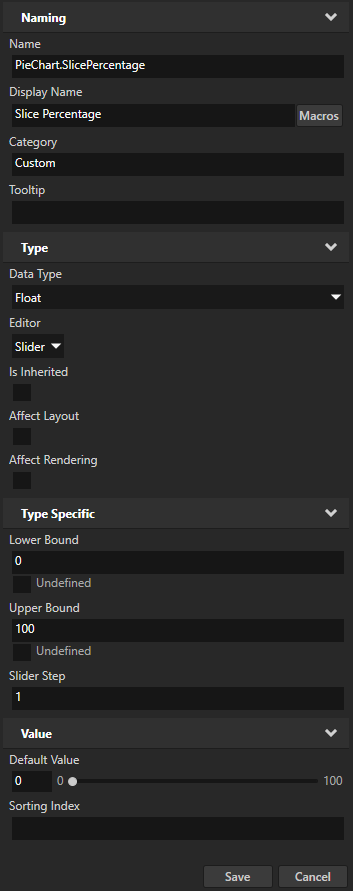
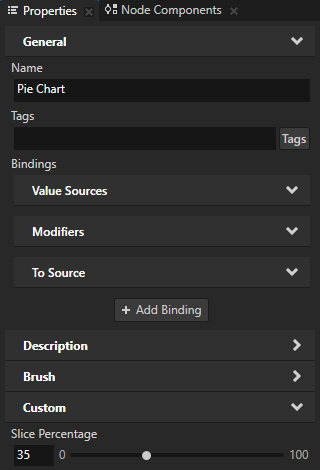
Create a property type that you use to control the size of a slice of the pie:
In the Library > Property Types, create a Property Type and set:
Name to PieChart.SlicePercentage
Display Name to Slice Percentage
Upper Bound to 100
Slider Step to 1
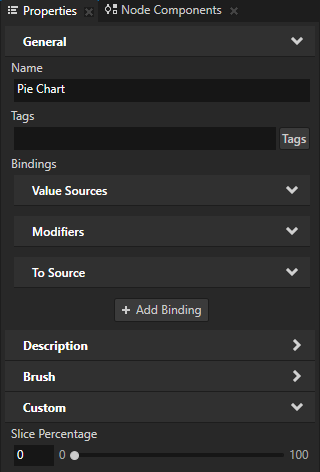
From the Library > Property Types, drag the PieChart.SlicePercentage property type to the Node Tree and drop it on the Pie Chart node.
Draw a slice of the pie:
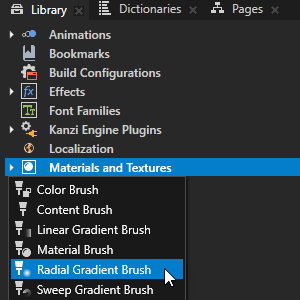
In the Library > Materials and Textures > Brushes, create the brush that you want to use to fill the slice.
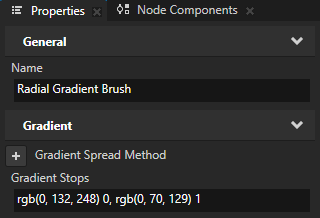
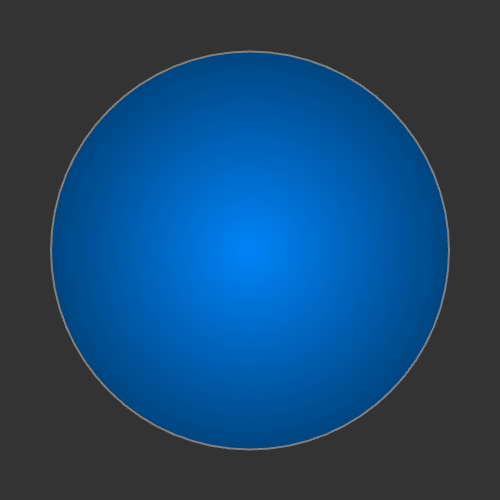
For example, create a Radial Gradient Brush. In the Properties, add the Gradient Stops property and set it to:
rgb(0, 132, 248) 0, rgb(0, 70, 129) 1
This way, you create a radial gradient from light blue to dark blue. See Gradients.
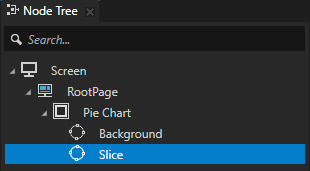
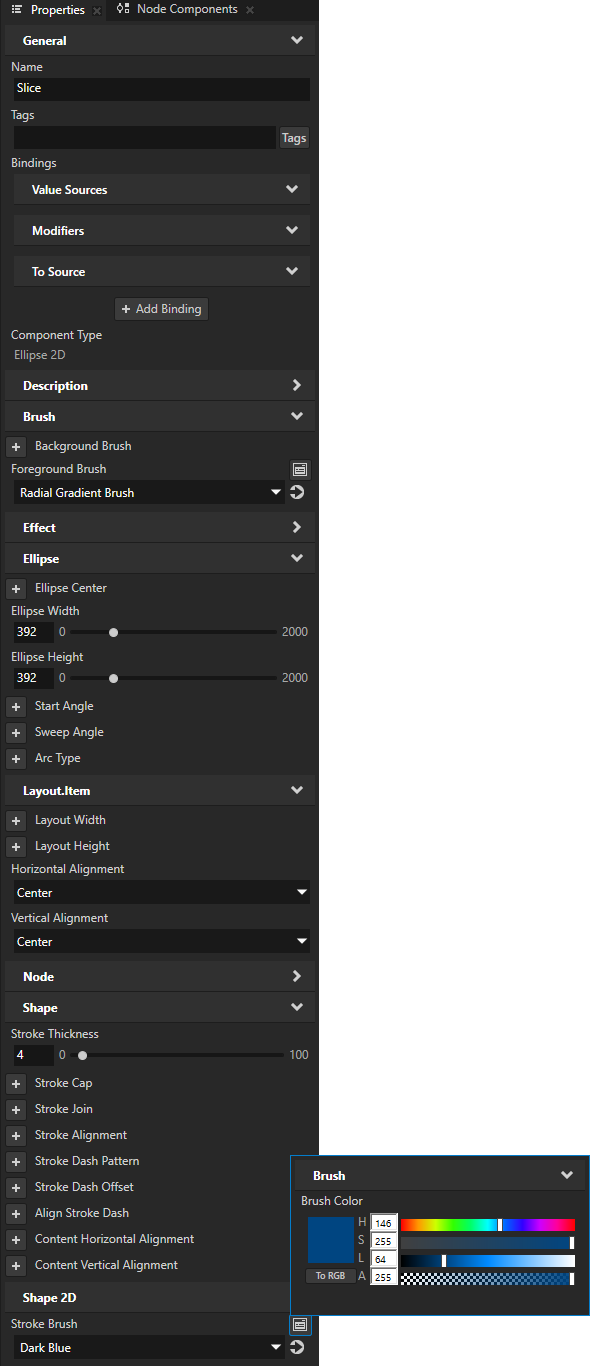
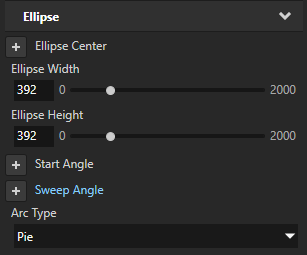
In the Node Tree in the Pie Chart node, create an Ellipse 2D node and name it Slice. In the Properties, add and set:
Foreground Brush to the brush that you created in the previous step.
Horizontal Alignment and Vertical Alignment to Center.
Ellipse Width and Ellipse Height to set the size of the ellipse.
For example, set them to 392.
(Optional) To draw the outline of the slice, add and set:
Stroke Brush to the brush that you want to use to fill the outline.
For example, select + Color Brush and name the brush. Click
next to the Stroke Brush property and set the Brush Color to the color that you want to use as the outline.Stroke Thickness to the width that you want for the outline.
You use this node to draw a slice of the pie chart.
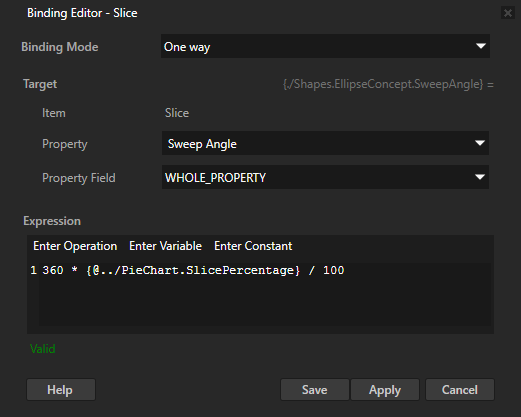
In the Node Tree, select the Slice node. In the Properties, click + Add Binding and in the Binding Editor, set:
Property to Ellipse > Sweep Angle
This property sets the angle between the start and end point of the arc that draws the slice of the pie.
Expression to
360 * {@../PieChart.SlicePercentage} / 100
Click Save.
You bind the Sweep Angle property to the value of the Slice Percentage property in the Pie Chart node and multiple the percentage by 360 to get the central angle of the slice.
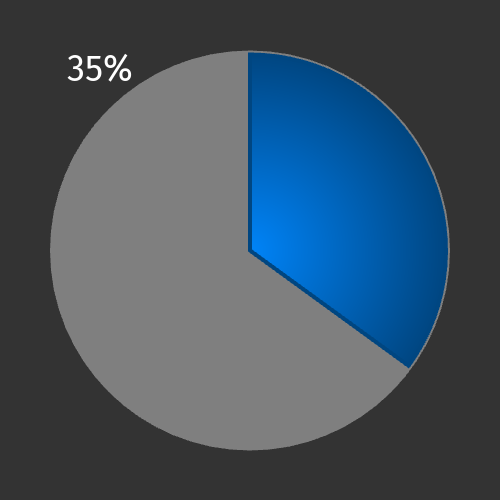
In the Node Tree, select the Pie Chart node. In the Properties, adjust the value of the Slice Percentage property.
When the value of the Sweep Angle property of an Ellipse 2D node is less than 360, Kanzi by default draws a circular segment without a chord.
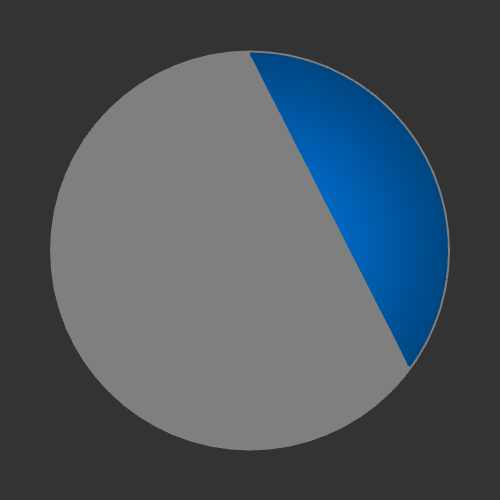
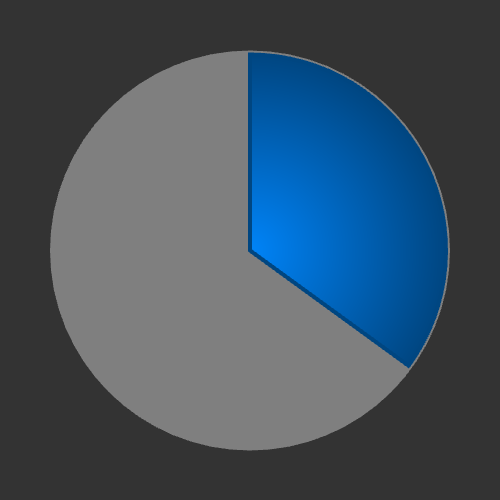
In the Node Tree, select the Slice node. In the Properties, add the Arc Type property and set it to Pie.
This way you set Kanzi to draw the Ellipse 2D node Slice in the shape of a pie.
Create labels that show the percentages of the pie chart occupied by the slice and the background:
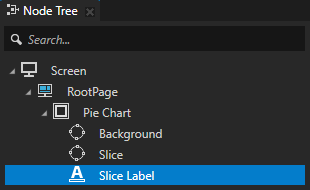
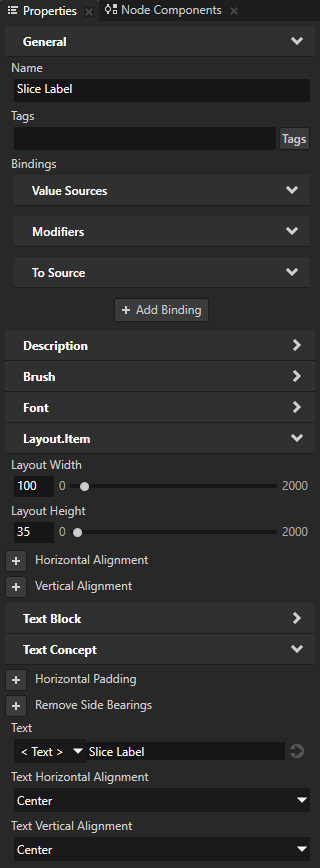
In the Node Tree in the Pie Chart node, create a Text Block 2D node and name it Slice Label. In the Properties, add and set:
Layout Width to 100
Layout Height to 35
Text Horizontal Alignment and Text Vertical Alignment to Center
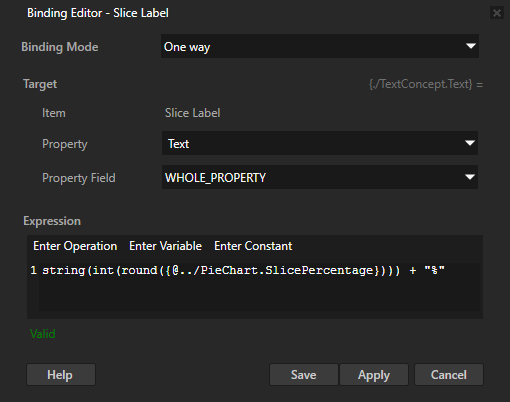
In the Properties, click + Add Binding and in the Binding Editor, set:
Property to Text
Expression to
string(int(round({@../PieChart.SlicePercentage}))) + "%"
Click Save.
You set the Slice Label node to show how many percent of the pie the slice occupies.
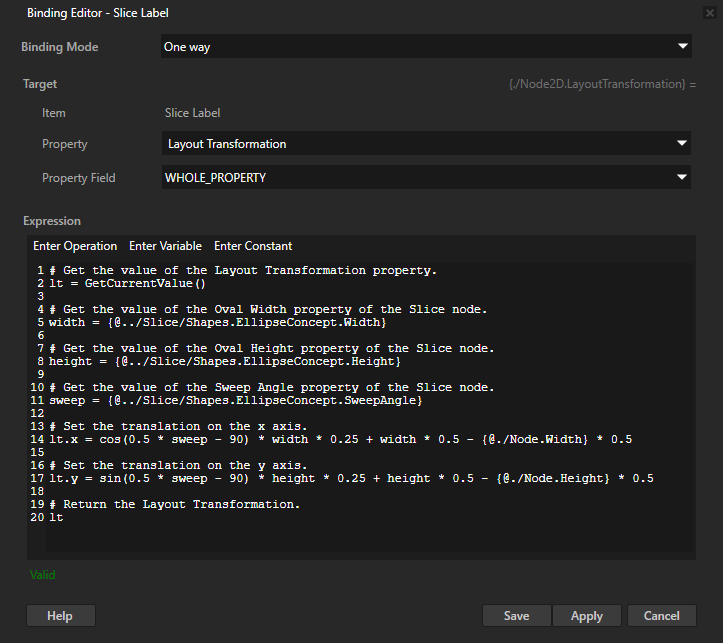
In the Properties, add another binding and in the Binding Editor, set:
Property to Transform 2D > Layout Transformation
Expression to
# Get the value of the Layout Transformation property.
lt = GetCurrentValue()

# Get the value of the Ellipse Width property of the Slice node.
width = {@../Slice/Shapes.EllipseConcept.Width}

# Get the value of the Ellipse Height property of the Slice node.
height = {@../Slice/Shapes.EllipseConcept.Height}

# Get the value of the Sweep Angle property of the Slice node.
sweep = {@../Slice/Shapes.EllipseConcept.SweepAngle}

# Set the translation on the x axis.
lt.x = cos(0.5 * sweep - 90) * width * 0.25 + width * 0.5 - {@./Node.Width} * 0.5

# Set the translation on the y axis.
lt.y = sin(0.5 * sweep - 90) * height * 0.25 + height * 0.5 - {@./Node.Height} * 0.5

# Return the Layout Transformation.
lt
Click Save.
You use this binding to position the Slice Label node so that it is always in the center of the slice.
In the Node Tree, duplicate the Slice Label node and rename it to Background Label. In the Properties:
Click the binding that binds the Text property, and in the Binding Editor, set Expression to:
string(100 - int(round({@../PieChart.SlicePercentage}))) + "%"Click the binding that binds the Layout Transformation property, and in the Binding Editor, set Expression to:
# Get the value of the Layout Transformation property.
lt = GetCurrentValue()

# Get the value of the Ellipse Width property of the Slice node.
width = {@../Slice/Shapes.EllipseConcept.Width}

# Get the value of the Ellipse Height property of the Slice node.
height = {@../Slice/Shapes.EllipseConcept.Height}

# Get the value of the Sweep Angle property of the Slice node.
sweep = {@../Slice/Shapes.EllipseConcept.SweepAngle}

# Set the translation on the x axis.
lt.x = cos(0.5 * sweep + 90) * width * 0.25 + width * 0.5 - {@./Node.Width} * 0.5

# Set the translation on the y axis.
lt.y = sin(0.5 * sweep + 90) * height * 0.25 + height * 0.5 - {@./Node.Height} * 0.5

# Return the Layout Transformation.
lt
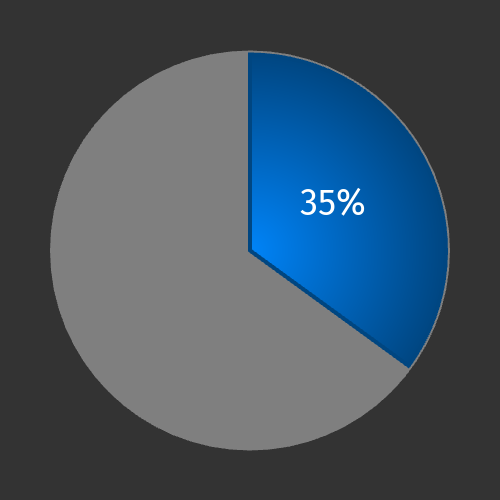
When you adjust the value of the Slice Percentage property in the Pie Chart node, in the Preview, the labels show the percentages and stay in the center of the slice and background.