Prism graphs
Prism graph editor is a visual node tool for creating render graphs. You can add or remove rendering nodes and quickly iterate on visual effects. Graphs provide a clear overview of rendering operations, let you adjust properties, and show results instantly.
Prism simplifies rendering complexities into a handful of basic primitive operations. A typical graph consists of one or more draw operations, shadow rendering operations, and post-processing effect compositions.
A Prism graph consists of nodes such as Draw, Blit, Clear and other more advanced nodes. Nodes are linked together using connections to form a render pipeline, where each operation runs according to the graph structure. Every graph has an output node that displays the final result on screen.
See Creating Prism graphs for a walkthrough on creating a Prism graph.
Prism graph presets
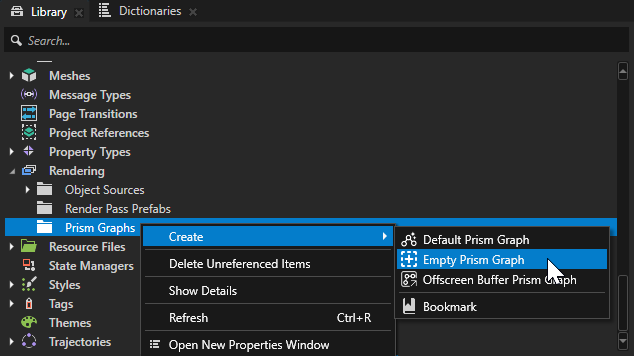
Prism offers quick presets to get started when you create a new graph. You can find the available presets when you create a new graph. Go to Library > Prism Graphs, right-click on Prism Graphs, and select Create > Template.
Default Prism Graph
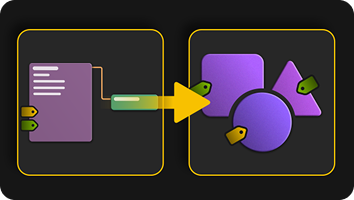
A preset configuration for a render graph similar to Kanzi’s default render pass. The preset draws opaque and transparent objects.
This is a good general starting point to start customizing your rendering.
Empty Prism Graph
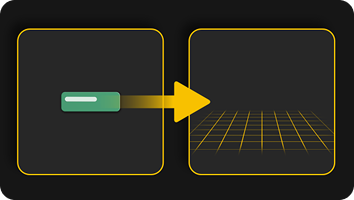
Empty Prism graph only has an output node. By default, this graph doesn’t render anything.
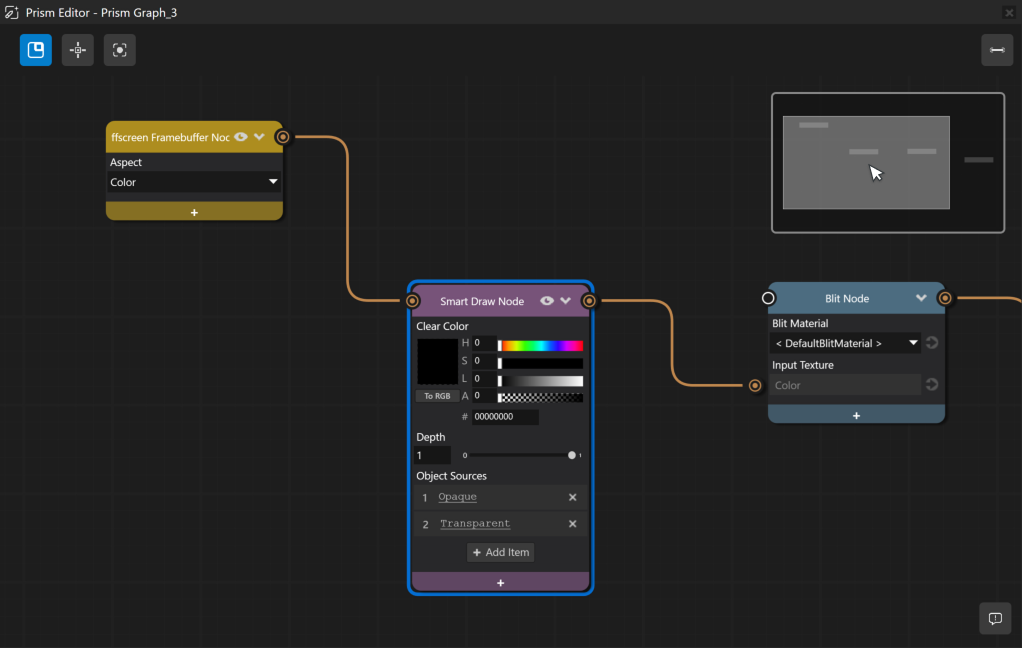
Offscreen Buffer Prism Graph
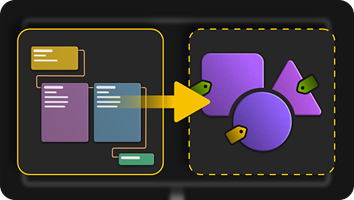
A preset tailored for quickly starting with offscreen or post-processing effects. The graph renders objects to screen and then composites a full-screen shader using blit nodes.
This is a good starting point for building post-processing or offscreen rendering effects where you want to apply a shader to all pixels on screen.
Working with Prism graphs
Here are the most common operations for editing Prism graphs.
Creating nodes
Right-click in the graph and select a node type.

Deleting nodes
Select a node and press Delete.
Or right-click and select Delete.
Connecting nodes
Drag from a socket with the left mouse button. Release on a valid socket to connect.
Disconnecting nodes
Select a connection and press Delete.
Or right-click and select Delete.
To delete multiple connections, hold Shift + Alt and draw a line over the connections.
Adding properties
Click the + icon on a node and select a property.
You can add multiple properties by clicking a property category.
Tip
Each Viewport that shares a Prism graph can override individual material property values independently. Select a property on a Prism node and click the Override value from Viewport button to set a per-Viewport value without affecting other Viewports that use the same graph.
Removing properties
Right-click a property and select Delete.
Adding and removing properties on a Render Pass node
On a Render Pass node, click  to open the Add Properties window. Use the window to add or remove any property the render pass supports.
Binding Render Pass node properties
You can bind a property on a Render Pass node so its value is driven by another property or by a binding expression. The following types of property bindings are supported:
Resource property bindings. Drag a binding line directly between two resource properties of the same type.
Text property bindings. Right-click a non-resource property row and select Edit binding… to drive the property from a binding expression. The row then shows a binding indicator and a read-only preview of the expression.
See Binding Render Pass node properties for worked examples.
Minimap
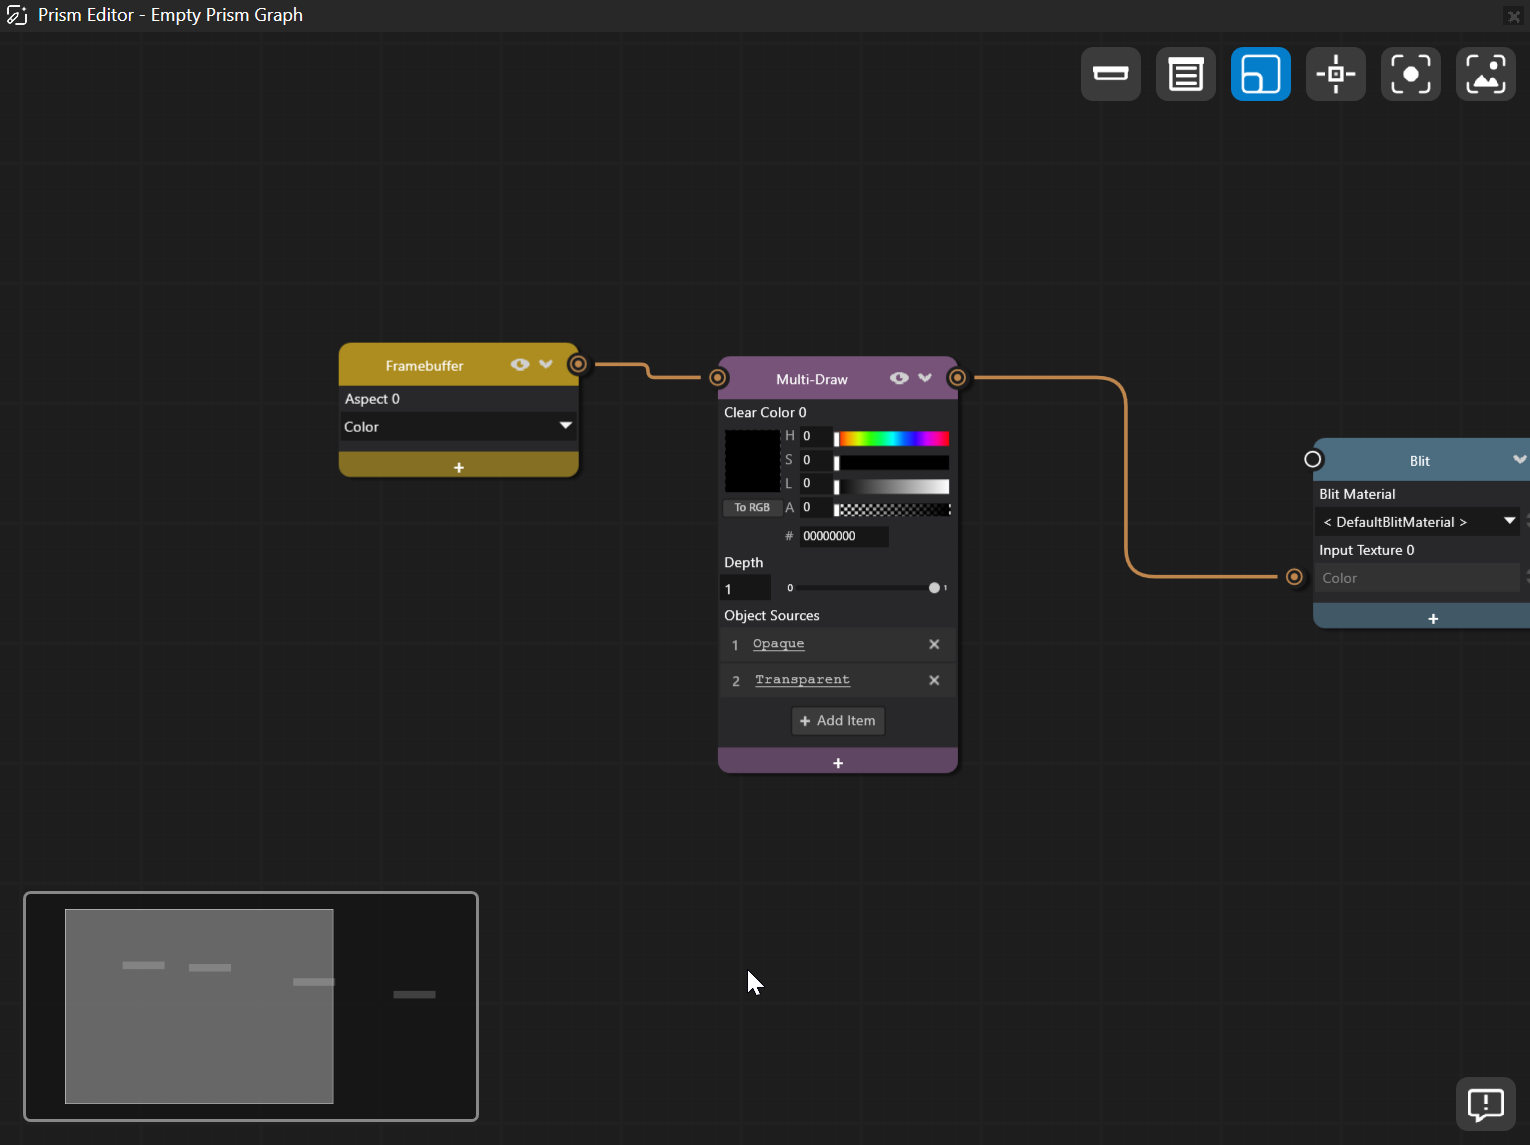
You can enable the minimap from the top-left corner of the Prism editor.
The minimap shows an overview of your graph. A light rectangle shows the visible area in the Prism Editor. Use the minimap to navigate large graphs.
Action |
Shortcut |
|---|---|
Resize |
Drag the lower-left corner of the minimap |
Zoom |
Scroll the mouse wheel |
Center view |
Click in the minimap |
Pan |
Drag in the minimap |
See also
Creating Bloom Effect with Prism Graphs
Adding shadows to Prism render graphs
Binding Render Pass node properties