Troubleshooting the performance of your application
Kanzi provides different means of measuring the performance of your application and displays various performance parameters. Use these means and parameters to improve the performance of your application.
Viewing the application performance in Kanzi Studio
To analyze the performance and inner structure of your application in Kanzi Studio, in the Preview click  to enter the Analyze mode, right-click
  , and select:
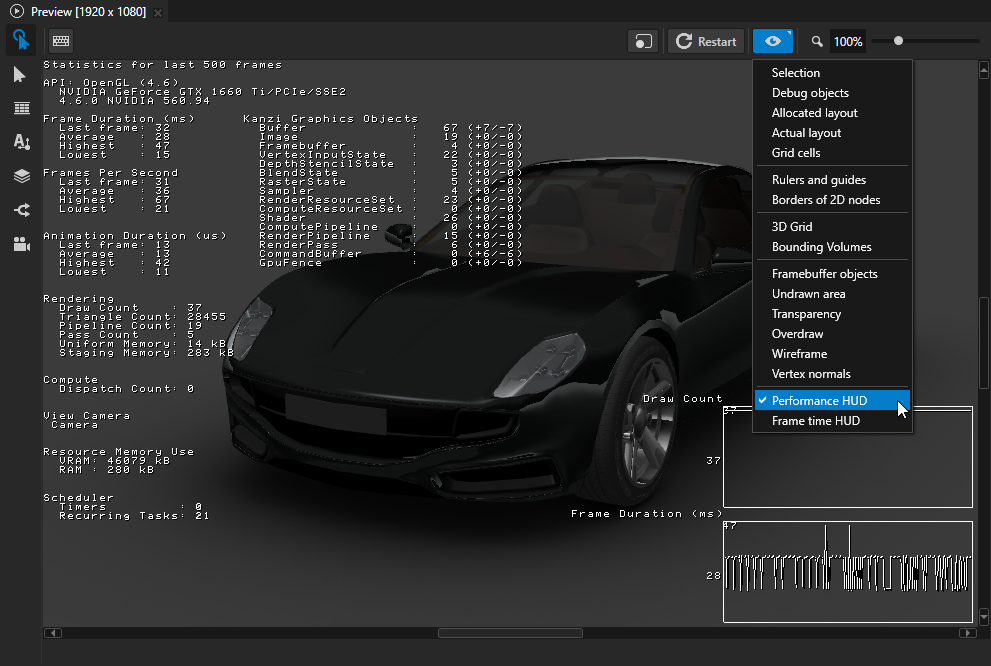
Performance HUD shows the overall performance indicators of your Kanzi application during the last 500 frames including:
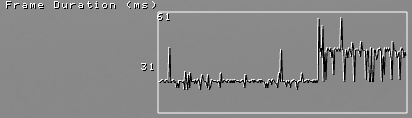
Frame Duration (ms) shows the time in milliseconds it took to render the last frame, and the average, highest, and lowest times.
The top value in the Frame Duration (ms) graph shows the longest, and the bottom value the average time it took to render a frame during the last 500 frames.
Use this information to identify performance bottlenecks in your Kanzi application. For example, you can use it to find out how to improve the performance of your application by distributing rendering across several frames. See Distributing rendering across several frames.
API shows the rendering API used by Kanzi. For Example, OpenGL ES or Vulkan. It also shows an identifier of the video card and driver version.
Frames Per Second shows the number of frames rendered per second.
Animation Duration (μs) shows the time in microseconds it takes to execute all animations in the application for the last frame, and the average, highest, and lowest times.
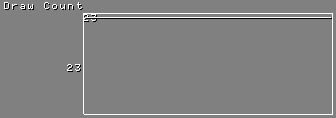
Draw Count shows how many individual draw calls were executed.
The top value in the Draw Count graph shows the highest number of batches during the last 500 frames, and the bottom value the number of batches in the last frame.
Triangle Count shows an estimated total of individual triangles drawn during a frame.
Pipeline Count shows how many times a new render pipeline was bound for the last frame. See Reducing shader switches.
Pass Count shows how many render passes were used in the last frame. See Rendering best practices.
Memory Upload shows how many bytes of rolling staging memory were used on the last frame as well as the total buffer size. Staging memory contains uniform data and temporary storage used for updating GPU resources like vertex buffers or textures. On some platforms unique buffers are used for each type of data.
Dispatch Count shows how many compute dispatches were used in the last frame.
Kanzi Graphics Objects shows a summary of the created Kanzi Graphics objects. In parenthesis is the number of created and deleted objects in the last frame.
View Camera shows the name of the Camera node that is used for displaying the scene in your application.
Resource Memory Use shows an estimated amount of local GPU memory (VRAM) and non-local GPU memory (RAM) that your Kanzi application uses.
The values that the Performance HUD shows in the Kanzi Studio Preview and when you run the Kanzi application on a target device differ because Kanzi Studio loads and keeps in memory all resources in the application.
Timers shows the number of registered timer handlers in the
MainLoopScheduler. Too many timer handlers can decrease the performance of your application. See Adding timers.You can access the number of timer subscriptions in the Kanzi Engine API by calling
MainLoopScheduler::getTimersCount.Recurring Tasks shows the total number of tasks that were added to the stages in the main loop scheduler. The Kanzi Engine adds some tasks by default. See Adding recurring tasks.
You can access the number of recurring tasks in the Kanzi Engine API by calling
MainLoopScheduler::getTasksTotalCount.Animations shows the number of active and all animations in your Kanzi application.
You can access the number of animations in the Kanzi Engine API:
To get the number of active animations, use
TimelineClock::getActiveTimelinePlaybackCount.To get the number of all animations, use
TimelineClock::getTimelinePlaybackCount.
Framebuffer objects marks with translucent yellow moving stripes node which are rendered into textures and cause a framebuffer object switch.
Transparency marks transparent nodes with translucent blue moving stripes. See Configuring nodes for efficient rendering.
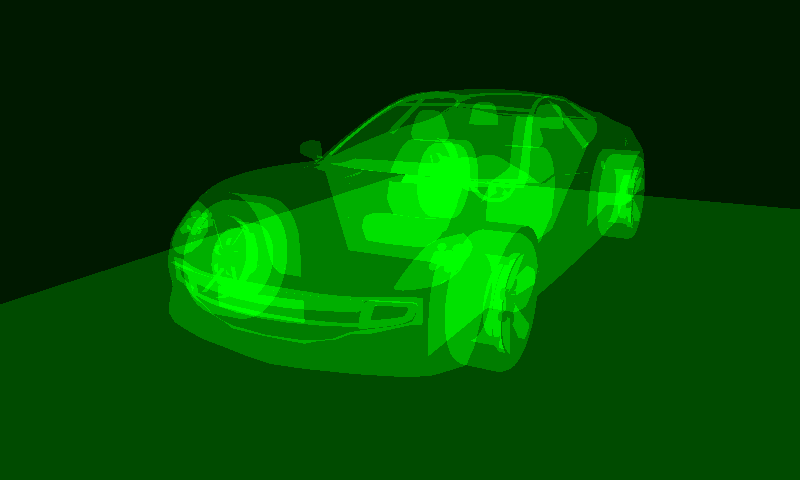
Overdraw visualization indicates areas where Kanzi renders multiple times to the same pixel. Lighter green color indicates higher amount of overdraw.
Viewing the overall performance
To view the overall performance of your Kanzi application:
In the Kanzi Studio Preview, click
and in the context menu enable Performance HUD.In the
application.cfg, enable the display of the full Performance HUD:PerformanceInfoLevel = 2
See PerformanceInfoLevel.
Enable the display of the Performance HUD in the application code in the
Application::onConfigurefunctionconfiguration.performanceInfoLevel = ApplicationProperties::PerformanceInfoLevelFull;
See PerformanceInfoLevel.
In the
application.hpp, enable the display of Performance HUD by calling theApplication::getPerformanceInfoLevelandApplication::setPerformanceInfoLevelfunctions:ApplicationProperties::PerformanceInfoLevel getPerformanceInfoLevel() const { return m_applicationProperties.performanceInfoLevel; } void setPerformanceInfoLevel(ApplicationProperties::PerformanceInfoLevel level) { m_applicationProperties.performanceInfoLevel = level; }
You can retrieve the current frame rate value by calling the
Application::getFramesPerSecondfunction in theapplication.hpp.To get the amount of time it takes to render a frame, use the
MainLoopSchedulertiming interfaceMainLoopScheduler::getLastFrameDuration.
Viewing the loading times of resources
In the application.cfg file or in the application code in the Application::onConfigure function you can set Kanzi to print to the debug console the amount of time it takes to load the resources kzb files that your application uses. See Measuring the loading and deployment time of resources.
Viewing the graphics performance
In the application.cfg file or in the application code in the Application::onConfigure function you can set Kanzi to print to the debug console:
Graphics-related information on application startup, such as the graphics API, device, and shading language version. See LogOpenGLInformation.
List of graphics-related properties on application startup, such as swap behavior, display size, and your application window size. See LogSurfaceInformation.
Log of the graphics API calls of your application. See GraphicsLoggingEnabled.
Viewing the overdraw of nodes
Overdraw visualization indicates areas where Kanzi renders multiple times to the same pixel. Lighter green color indicates higher amount of overdraw.
Kanzi uses the stencil buffer to calculate how many times it draws to the same pixel. If you are using the stencil buffer to render your content, the Overdraw visualization can return unexpected results.
The overdraw visualization does not show:
Overdraw for 3D nodes that you render to a composition, which you then render to a texture. In that case, the Overdraw visualization shows the content from a composition that you render to a texture, as a single quad.
Parts of the nodes that are clipped when you set in their ancestor node the Clip Children property to enabled.
Nodes that are completely translucent or nodes that are not visible, including their descendant nodes.
To view overdraw in your application, in the Kanzi Studio Preview click to enter the Analyze mode, right-click , and select Overdraw.
Viewing nodes that are rendered into texture
Switching between framebuffer objects can cause significant performance reduction on some platforms. Conditions when Kanzi renders a node into a texture can be complex. For example, rotation, scale, or opacity can cause render to texture to occur.
To see whether a node is rendered into a texture, and causing a framebuffer object switch, in the Preview click to enter the Analyze mode, right-click , and select Framebuffer objects.
The Preview highlights the layers that are rendered into texture with transparent, orange stripes.
Viewing nodes rendered to a composition render target
In Kanzi Studio you can see which 2D nodes in your application Kanzi renders to a composition render target.
To view in the Preview the 2D nodes that use alpha blending in the Preview click to enter the Analyze mode, right-click , and select Transparency.
The Preview highlights the nodes that Kanzi renders to a composition render target with translucent, blue stripes.
See also
Measuring the loading and deployment time of resources
Application configuration reference