Analyzing your application in the Preview
In the Preview, click  to analyze the performance and structure of your application.
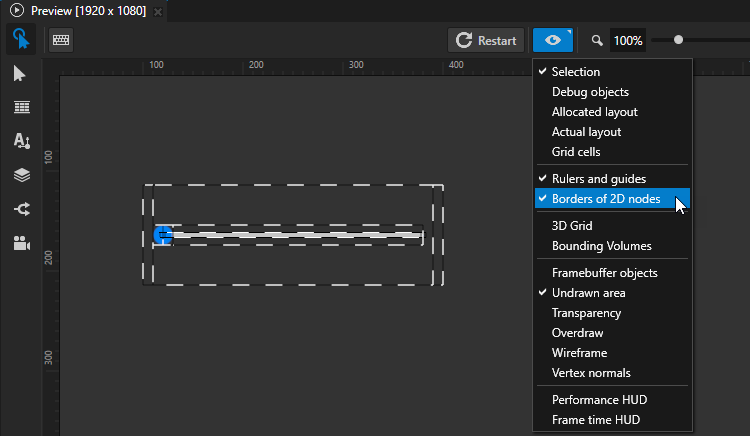
When in the Analyze mode, right-click  or use the Preview main menu to select the type of items that you want to analyze.
In addition to the Preview Analyze mode, Kanzi provides other ways to help you analyze your application. See Troubleshooting the performance of your application and Best practices.
Tip
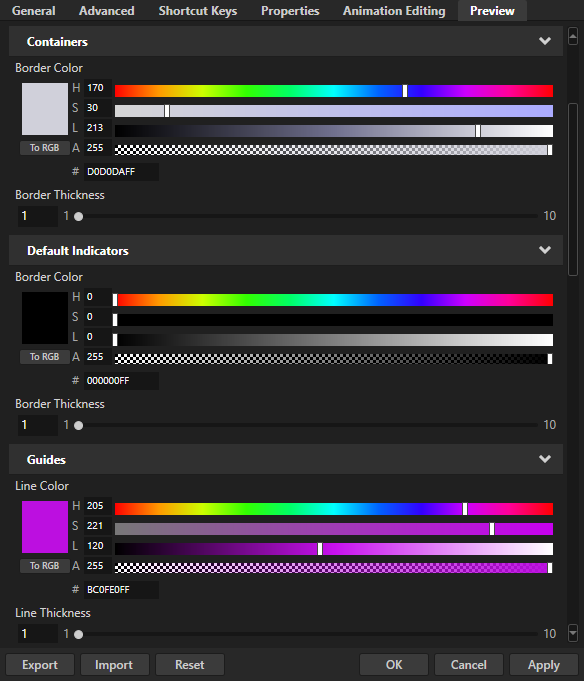
To customize how Kanzi Studio shows different types of items in the Analyze mode, select Edit > User Preferences, and in the Preview tab set the color and line thickness for the items.
Selection and layout
|
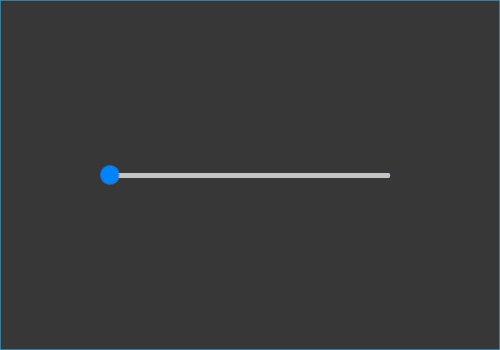
Selection highlights the selected nodes. See Editing your application in the Preview. |
|
Debug objects shows:
|
|
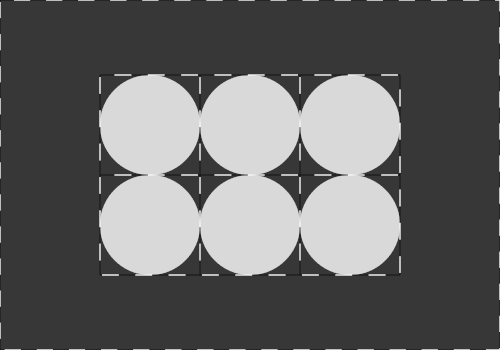
Allocated layout shows bounding boxes of the spaces allocated to items under layouts. See Layout control nodes. |
|
Actual layout shows bounding boxes of spaces used by items under layouts. See Layout control nodes. |

|
Grid cells shows the cells of Grid Layout 2D nodes. See Using the Grid Layout nodes. |
Rulers, guides, and borders
|
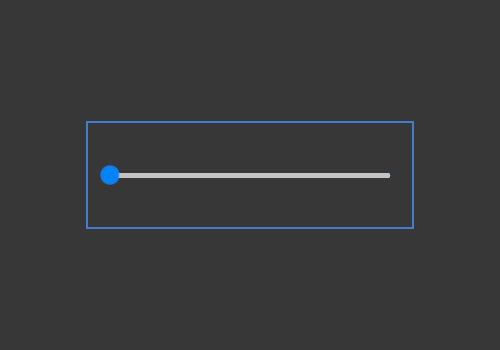
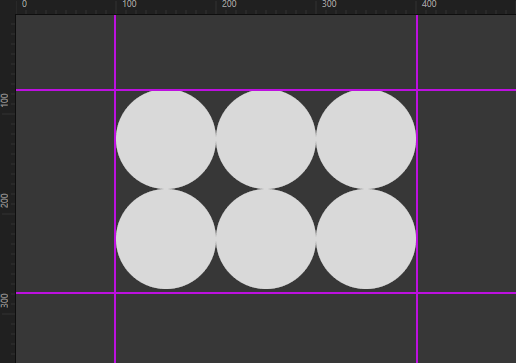
Rulers and guides shows rulers and guides which help you position the elements in your application. See Using rulers and guides. |
|
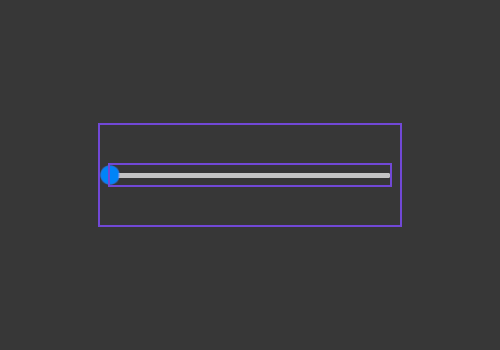
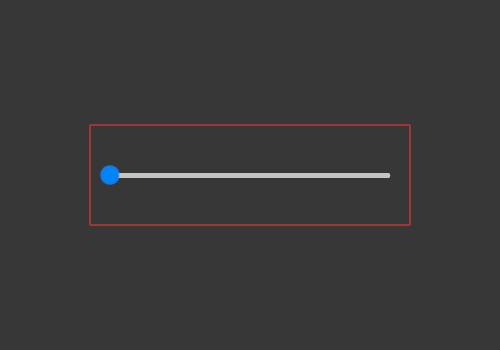
Borders of 2D nodes outlines the borders of 2D nodes with striped lines. |
3D content
|
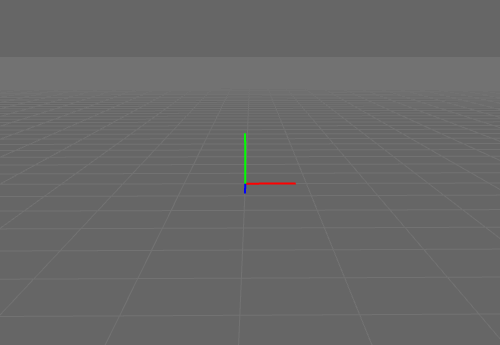
3D Grid shows the ground plane grid in Scene nodes. |
|
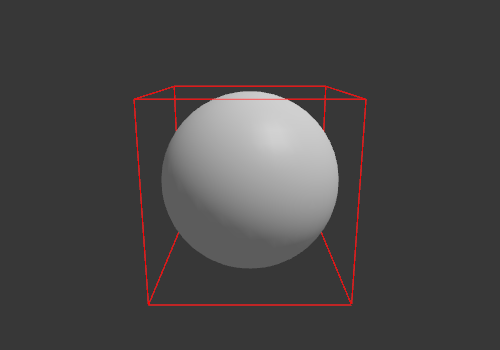
Bounding volumes shows meshes in closed volumes. |
Rendering
|
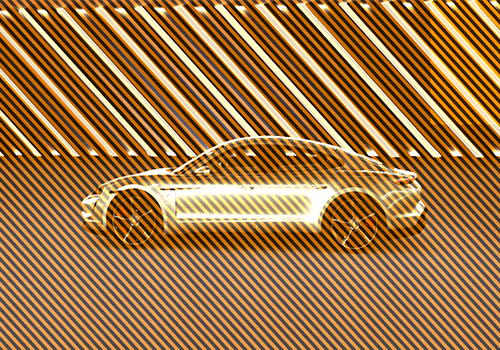
Framebuffer objects marks with translucent yellow moving stripes node which are rendered into textures and cause a framebuffer object switch. |

|
Undrawn area shows the updating of the areas beyond the application screen and the areas with content not rendered. |

|
Transparency marks transparent nodes with translucent blue moving stripes. See Configuring nodes for efficient rendering. |

|
Overdraw visualization indicates areas where Kanzi renders multiple times to the same pixel. Lighter green color indicates higher amount of overdraw. |
|
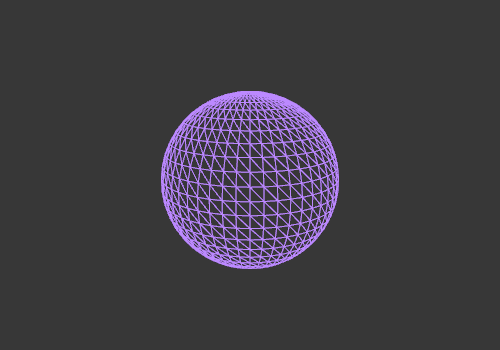
Wireframe draws all content in wireframe mode, which shows the geometry of meshes. Keep in mind that Kanzi applies the wireframe mode to the content globally. For example, the mode renders as wireframes also post-processing effects and the content that you blit on the screen using render passes. |

|
Vertex normals visualizes the normals of mesh vertices as RGB colors. The values of the red, green, and blue color channels represent the x, y, and z values of the normal direction vector in the local space of the mesh. Kanzi calculates the value of each color channel from the value of the corresponding direction vector component according to this formula:
\[ColorChannel = 0.5 + 0.5 * VectorComponent\]
|
Performance
Performance HUD shows the overall performance indicators of your Kanzi application during the last 500 frames including:
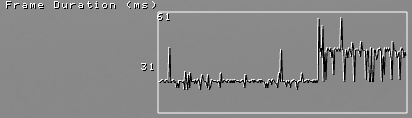
Frame Duration (ms) shows the time in milliseconds it took to render the last frame, and the average, highest, and lowest times.
The top value in the Frame Duration (ms) graph shows the longest, and the bottom value the average time it took to render a frame during the last 500 frames.
Use this information to identify performance bottlenecks in your Kanzi application. For example, you can use it to find out how to improve the performance of your application by distributing rendering across several frames. See Distributing rendering across several frames.
API shows the rendering API used by Kanzi. For Example, OpenGL ES or Vulkan. It also shows an identifier of the video card and driver version.
Frames Per Second shows the number of frames rendered per second.
Animation Duration (μs) shows the time in microseconds it takes to execute all animations in the application for the last frame, and the average, highest, and lowest times.
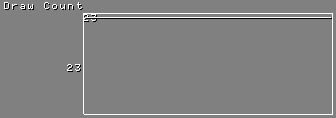
Draw Count shows how many individual draw calls were executed.
The top value in the Draw Count graph shows the highest number of batches during the last 500 frames, and the bottom value the number of batches in the last frame.
Triangle Count shows an estimated total of individual triangles drawn during a frame.
Pipeline Count shows how many times a new render pipeline was bound for the last frame. See Reducing shader switches.
Pass Count shows how many render passes were used in the last frame. See Rendering best practices.
Memory Upload shows how many bytes of rolling staging memory were used on the last frame as well as the total buffer size. Staging memory contains uniform data and temporary storage used for updating GPU resources like vertex buffers or textures. On some platforms unique buffers are used for each type of data.
Dispatch Count shows how many compute dispatches were used in the last frame.
Kanzi Graphics Objects shows a summary of the created Kanzi Graphics objects. In parenthesis is the number of created and deleted objects in the last frame.
View Camera shows the name of the Camera node that is used for displaying the scene in your application.
Resource Memory Use shows an estimated amount of local GPU memory (VRAM) and non-local GPU memory (RAM) that your Kanzi application uses.
The values that the Performance HUD shows in the Kanzi Studio Preview and when you run the Kanzi application on a target device differ because Kanzi Studio loads and keeps in memory all resources in the application.
Timers shows the number of registered timer handlers in the
MainLoopScheduler. Too many timer handlers can decrease the performance of your application. See Adding timers.You can access the number of timer subscriptions in the Kanzi Engine API by calling
MainLoopScheduler::getTimersCount.Recurring Tasks shows the total number of tasks that were added to the stages in the main loop scheduler. The Kanzi Engine adds some tasks by default. See Adding recurring tasks.
You can access the number of recurring tasks in the Kanzi Engine API by calling
MainLoopScheduler::getTasksTotalCount.Animations shows the number of active and all animations in your Kanzi application.
You can access the number of animations in the Kanzi Engine API:
To get the number of active animations, use
TimelineClock::getActiveTimelinePlaybackCount.To get the number of all animations, use
TimelineClock::getTimelinePlaybackCount.
Frame time HUD shows these frame time indicators of your Kanzi application during the last 500 frames:
Frame Duration (ms) shows the time in milliseconds it took to render the last frame, and the average, highest, and lowest times.
Frames Per Second shows the number of frames rendered per second.
Animation Duration (μs) shows the time in microseconds it takes to execute all animations in the application for the last frame, and the average, highest, and lowest times.
The Preview log file
Kanzi Studio stores the Preview log messages in the %USERPROFILE%\AppData\Local\Temp\KanziStudioLogs\KanziPreview.log file.
To set the level of logging detail, in the <KanziInstallation>\Studio\Bin\KanziPreview.exe.config file set the value of the logLevel key:
NORMALsets Kanzi Studio to log the regular Kanzi Studio Preview flow, including errors and exceptions.VERBOSEsets Kanzi Studio to log all low-level communication between Kanzi Studio and the Preview at a millisecond-level of precision.When you set the log level to
VERBOSE, the large amount of log messages can reduce the performance of Kanzi Studio.NONEsets Kanzi Studio to not log any messages to theKanziPreview.logfile.
For example, to log all communication between Kanzi Studio and the Preview, open the KanziPreview.exe.config file in a text editor, and set:
<add key="logLevel" value="VERBOSE"/>
To apply the changes to the KanziPreview.exe.config, save the KanziPreview.exe.config file and press Ctrl F8 to restart the Preview. See Controlling the Preview.
Every time you restart the Preview, Kanzi Studio overwrites the contents of the KanziPreview.log file.
See also
Troubleshooting the performance of your application