Measuring the performance of Kanzi Engine
Use the Profiling build to measure the performance of different parts of Kanzi Engine. This build includes profiled Kanzi libraries.
Performance profiling categories in the Profiling build
The Profiling build comes with performance profiling categories and profilers that you can use to measure the performance of different parts of Kanzi Engine:
Startup performance profilers measure the time Kanzi uses during application startup.
For example, use the startup performance profilers to measure the amount of time it takes to initialize the application, open the startup kzb file, and load plugins.
Main loop profiler measures the time used by the tasks that Kanzi runs in the main loop. You can use this to find out what affects the frame rate of your application.
For example, use the main loop profiler to measure the amount of time it takes to handle input events, calculate layouts, run animations, update application state, and render nodes.
See Main loop profiler.
Startup performance profiling categories
The startup performance profilers measure the time Kanzi Engine spends on different tasks during application startup. The startup performance profilers are registered in kanzi::StartupProfilerRegistry. By default, all startup performance profiling categories are enabled. To set the state of a category in the application configuration, use the Configuration name. See ProfilingCategoryFilter.
This table lists the Kanzi startup performance profiling categories and profilers that are included in the Profiling build.
Category |
Configuration name |
Profiler |
|---|---|---|
Application initialization |
|
|
Default resource registration |
|
|
Graphics initialization |
|
|
GL subsystem initialization |
|
|
Startup kzb file opening |
|
|
Loading threads initialization |
|
|
Metadata registration |
|
|
Plugins loading |
|
|
Prefabs loading |
|
|
Prefabs instantiation |
|
|
Prefabs attachment |
|
|
Renderer reset |
|
|
Runtime assets registration |
|
|
Domain creation |
|
|
|
|
|
|
|
|
Main loop profiler
The main loop profiler measures the time that Kanzi Engine spends on different tasks on each iteration of the Kanzi main loop. You can enable the main loop profiler by adding the MainLoop category in the application configuration. See ProfilingCategoryFilter.
You can access the main loop profiler though the main loop scheduler interface MainLoopScheduler::getProfiler(). You can access the main loop scheduler from Application using Application::getMainLoopScheduler().
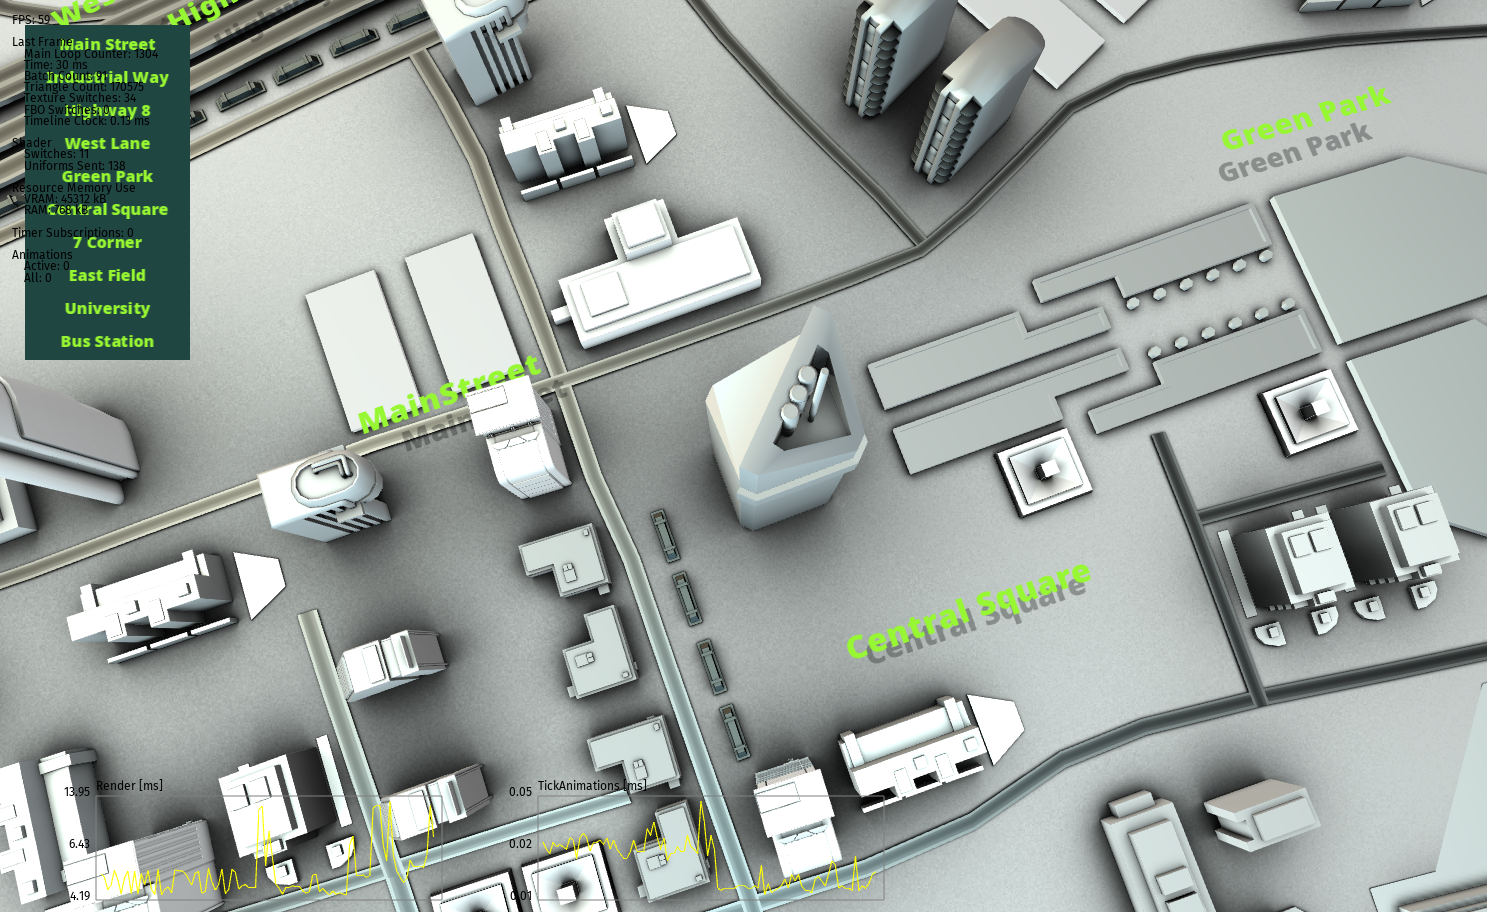
In the Performance HUD you can show the performance measurement graphs for the main loop tasks. See Showing the performance measurement graphs in the Performance HUD.
In the application configuration you can set the sample buffer size in the main loop performance profilers. See MainLoopProfilingSampleBufferCount.
Showing the performance measurement graphs in the Performance HUD
You can show performance profiling graphs for any main loop task in the Profiling build, including custom tasks that you add in your application code.
To show performance measurement graphs in the Performance HUD:
In the application configuration enable the display of the full Performance HUD:
In
application.cfg:PerformanceInfoLevel = 2
In the
onConfigure()function:configuration.performanceInfoLevel = ApplicationProperties::PerformanceInfoLevelFull;
In the application configuration enable the main loop profiling category.
In
application.cfg:ProfilingCategoryFilter="MainLoop=on"
In the
onConfigure()function:configuration.profilingCategoryFilter = "MainLoop=on";
In the application configuration enable the graphs for the tasks that you want to display. For the names of the default main loop tasks, see the definition of
Application::initializeMainLoopTasks().For example, to show the graphs for tasks TickAnimations and Render, set:
In
application.cfg:PerformanceInfoGraphFilter="TickAnimations;Render"
In the
onConfigure()function:configuration.performanceInfoProperties.graphFilter = "TickAnimations;Render";
(Optional) Set the colors that Kanzi uses to draw the Performance HUD:
In Visual Studio in the file where you want to set the colors, include the
performance_info.hppheader file.For example, to set the colors that Kanzi uses to draw the Performance HUD of the Scroll view example, in the
scroll_view.cppfile add:#include <kanzi/core.ui/application/performance_info.hpp>
Set the colors that Kanzi uses to show the Performance HUD graph frames, graph data, and text.
For example, in the
scroll_view.cppfile in theonProjectLoadedfunction add:// Get the performanceInfo object. If the object does not exist, create it. PerformanceInfo& performanceInfo = acquirePerformanceInfo(); // Set the color of graph frames to gray. performanceInfo.setBorderColor(ColorRGBA(0.5f, 0.5f, 0.5f)); // Set the color of graph data to yellow. performanceInfo.setLineColor(ColorRGBA(1.0f, 1.0f, 0.0f)); // Set the color of text to black. performanceInfo.setFontColor(ColorRGBA(0.0f, 0.0f, 0.0f));
Build and run your application. See Deploying Kanzi applications.
To show the performance graphs, you must use the Profiling build of Kanzi.
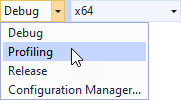
For example, on Windows build your application in Visual Studio using the Profiling build configuration.
When you run the application, the Performance HUD shows the performance measurement graphs.
If you do not see the graphs, make the application window larger.
Logging Kanzi Engine performance profiling data
To analyze the performance of Kanzi Engine, log the performance profiling data.
Logging startup performance information
You can use the Kanzi startup performance profilers in the Profiling build to measure the time Kanzi Engine spends on different tasks during application startup. See Startup performance profiling categories.
To log startup performance information, build your application using the Profiling build configuration.
For example, to build and run your application on Windows:
In Visual Studio build your application using the Profiling build configuration.
Open the command line on your computer and run the application so that you direct the application output to a file where you want to store the performance measurements data.
<MyProject>\Application\bin> ..\build_vs<Version>\runtime\Profiling\MyApplication.exe > MyApplicationProfiling.log
Kanzi writes the startup performance measurement information to the log.
...
info:profiling> Startup profiling:
info:profiling> StartupInitialization                        335 981 800 ns
info:profiling> |-- StartupInitializeGraphics                304 665 900 ns
info:profiling> |-- StartupCreateDomain                        1 450 500 ns
info:profiling> |-- StartupInitializeLoadingThreads           26 921 700 ns
info:profiling> |-- StartupRegisterRuntimeAssets                 122 800 ns
info:profiling> |-- StartupLoadPlugins                               200 ns
info:profiling> |-- StartupRegisterMetadata                      776 100 ns
info:profiling> |-- StartupOpenKzb                             1 106 000 ns
info:profiling> StartupInitializeGL                                  100 ns
info:profiling> StartupResumeGL                                1 316 800 ns
info:profiling> StartupLoadPrefab                            808 960 000 ns
info:profiling> StartupInstantiatePrefab                       1 351 700 ns
info:profiling> StartupRegisterDefaultResources                   17 400 ns
info:profiling> StartupAttachPrefab                           16 614 700 ns
info:profiling> StartupResetRenderer                              59 700 ns
info:profiling> StartupOnProjectLoaded                            38 600 ns
info:profiling> Startup profiling data logging took   1 712 800 ns
...
Logging data from a profiler
You can log data from specific profilers:
To log all data samples from a profiler, use the
logAllDatafunction.For example, to log all data from the main loop profiler use:
getMainLoopScheduler().getProfiler()->logAllData();
To log a summary of data from a profiler, use the
logAggregateDatafunction. Keep in mind that not all profilers implement aggregate logging.For example, to log a summary of data from the
m_initializationProfilerofStartupProfilerRegistry, use:getStartupProfilerRegistry().m_initializationProfiler->logAggregateData();
Logging data from a profiler registry
You can log data from all profilers registered in a specific profiler registry by iterating through the profilers and calling the logAggregateData() or logAllData() function.
For example, to log a summary of performance profiling data from your custom profiler when exiting the application:
// Kanzi calls this function when the application exits.
void onShutdown() override
{
    // Get the default profiler registry.
    const auto& registry = kzProfilingGetDefaultRegistry();

    // Go through all profilers in the registry and log their aggregate data.
    for (auto profilerIter = registry.beginProfilers(),
        profilerIterEnd = registry.endProfilers();
        profilerIter != profilerIterEnd; ++profilerIter)
    {
        (*profilerIter)->logAggregateData();
    }
}