Debugging native Kanzi Engine plugins
You can debug your native Kanzi Engine plugins in the Kanzi Studio Preview using Visual Studio.
To debug a native Kanzi Engine plugin:
In Visual Studio create your Kanzi Engine plugin and build it using the Debug build configuration.
See Creating Kanzi Engine plugins.
Import your Kanzi Engine plugin to a Kanzi Studio project.
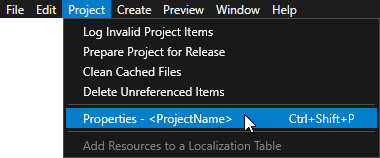
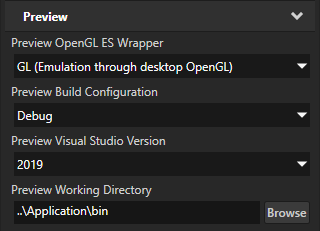
In Kanzi Studio in the project which uses the Kanzi Engine plugin that you want to debug select Project > Properties and in the Properties set:
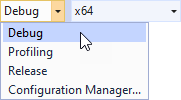
Preview Build Configuration to Debug
Preview Visual Studio Version to the version in the solution configuration you used in Visual Studio to build your plugin
For example, set it to 2019.
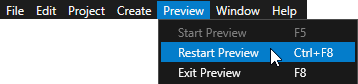
Hold down the Ctrl Shift keys, in the main menu select Preview > Restart Preview, and wait until Kanzi Studio opens the Debug Preview dialog.
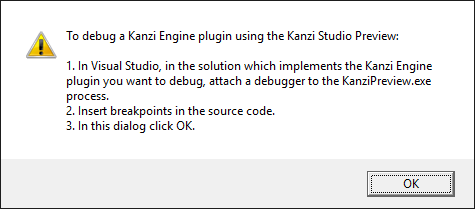
Attach the Visual Studio debugger to the Kanzi Studio Preview process:
In Visual Studio select Debug > Attach to Process.
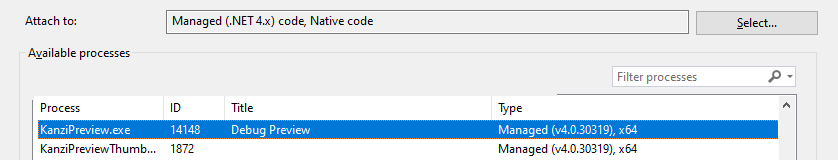
In the Attach to Process dialog:
In the Available Processes list select the
KanziPreview.exeprocess titled Debug Preview.In the Attach to box make sure that these code types are listed:
Managed (.NET 4.x) code
Native code
Click Attach.
In Visual Studio insert the breakpoints in the Kanzi Engine plugin source code.
In the Debug Preview dialog click OK.
Now when you interact with your application in the Kanzi Studio Preview, whenever one of the breakpoints you inserted in the code is hit, Visual Studio stops executing the code and you can debug your Kanzi Engine plugin.